
 We respect your privacy. Please refer to our full
 Transportation Investment Banking: How to Hop on the Train to Mega-Deals
Transportation investment banking is normally a sub-group within the larger industrials investment banking team, but it’s different enough to justify a separate article.
Plus, the older version of this article and the one on maritime shipping needed major updates.
Transportation IB is interesting because it intersects with many other groups: Infrastructure, Public Finance, Metals & Mining, and Oil & Gas.
Also, it consistently generates large, high-profile deals, despite being removed from “hot” areas, like technology.
If you’re already interested in industrials, transportation is a contender for the top group.
And if not, you might become interested by the time you finish reading this:
- What is Transportation Investment Banking?
- Wheeling and Dealing as an Analyst or Associate
- Transportation Trends and Drivers
- Transportation Investment Banking by Vertical
- Transportation Accounting, Valuation, and Financial Modeling
- Example Valuations, Pitch Books, Fairness Opinions, and Investor Presentations
- The Top Transportation Investment Banking Groups and Firms
- Exit Opportunities
- How to Learn More About Transportation
- Should You Catch the Next Train into Transportation Investment Banking?
What is Transportation Investment Banking?
Transportation Investment Banking Definition: In transportation IB, bankers advise companies within air freight/logistics, passenger airlines, marine transportation, ground transportation, and transportation infrastructure on debt, equity, and M&A deals.
This description is taken directly from the Capital IQ breakout:
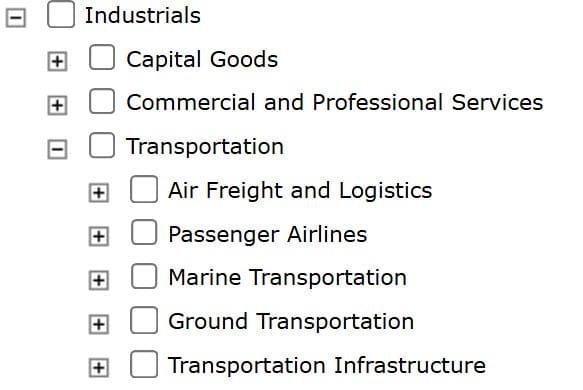
Most of the points that define industrials also apply to transportation: Companies transport machinery and large physical products, the customers are companies or governments (except for passenger airlines), and the sector is highly sensitive to macroeconomic conditions.
We covered “transportation infrastructure” in the separate article on infrastructure investment banking, so we’ll focus on the first four verticals here.
Also, note that aerospace companies, such as Boeing, are not considered “transportation firms”; they are normally classified within “Capital Goods” in industrials.
Few banks have separate Transportation & Logistics groups, but one major exception is Morgan Stanley, which has a well-known, dedicated team.
Transportation is not very specialized, so a matching work experience background may help a bit, but less so than in a group like real estate, FIG, or oil & gas.
Wheeling and Dealing as an Analyst or Associate
To get a sense of deal activity in the sector, you can look at recent transactions executed by a leading logistics company, like FedEx:
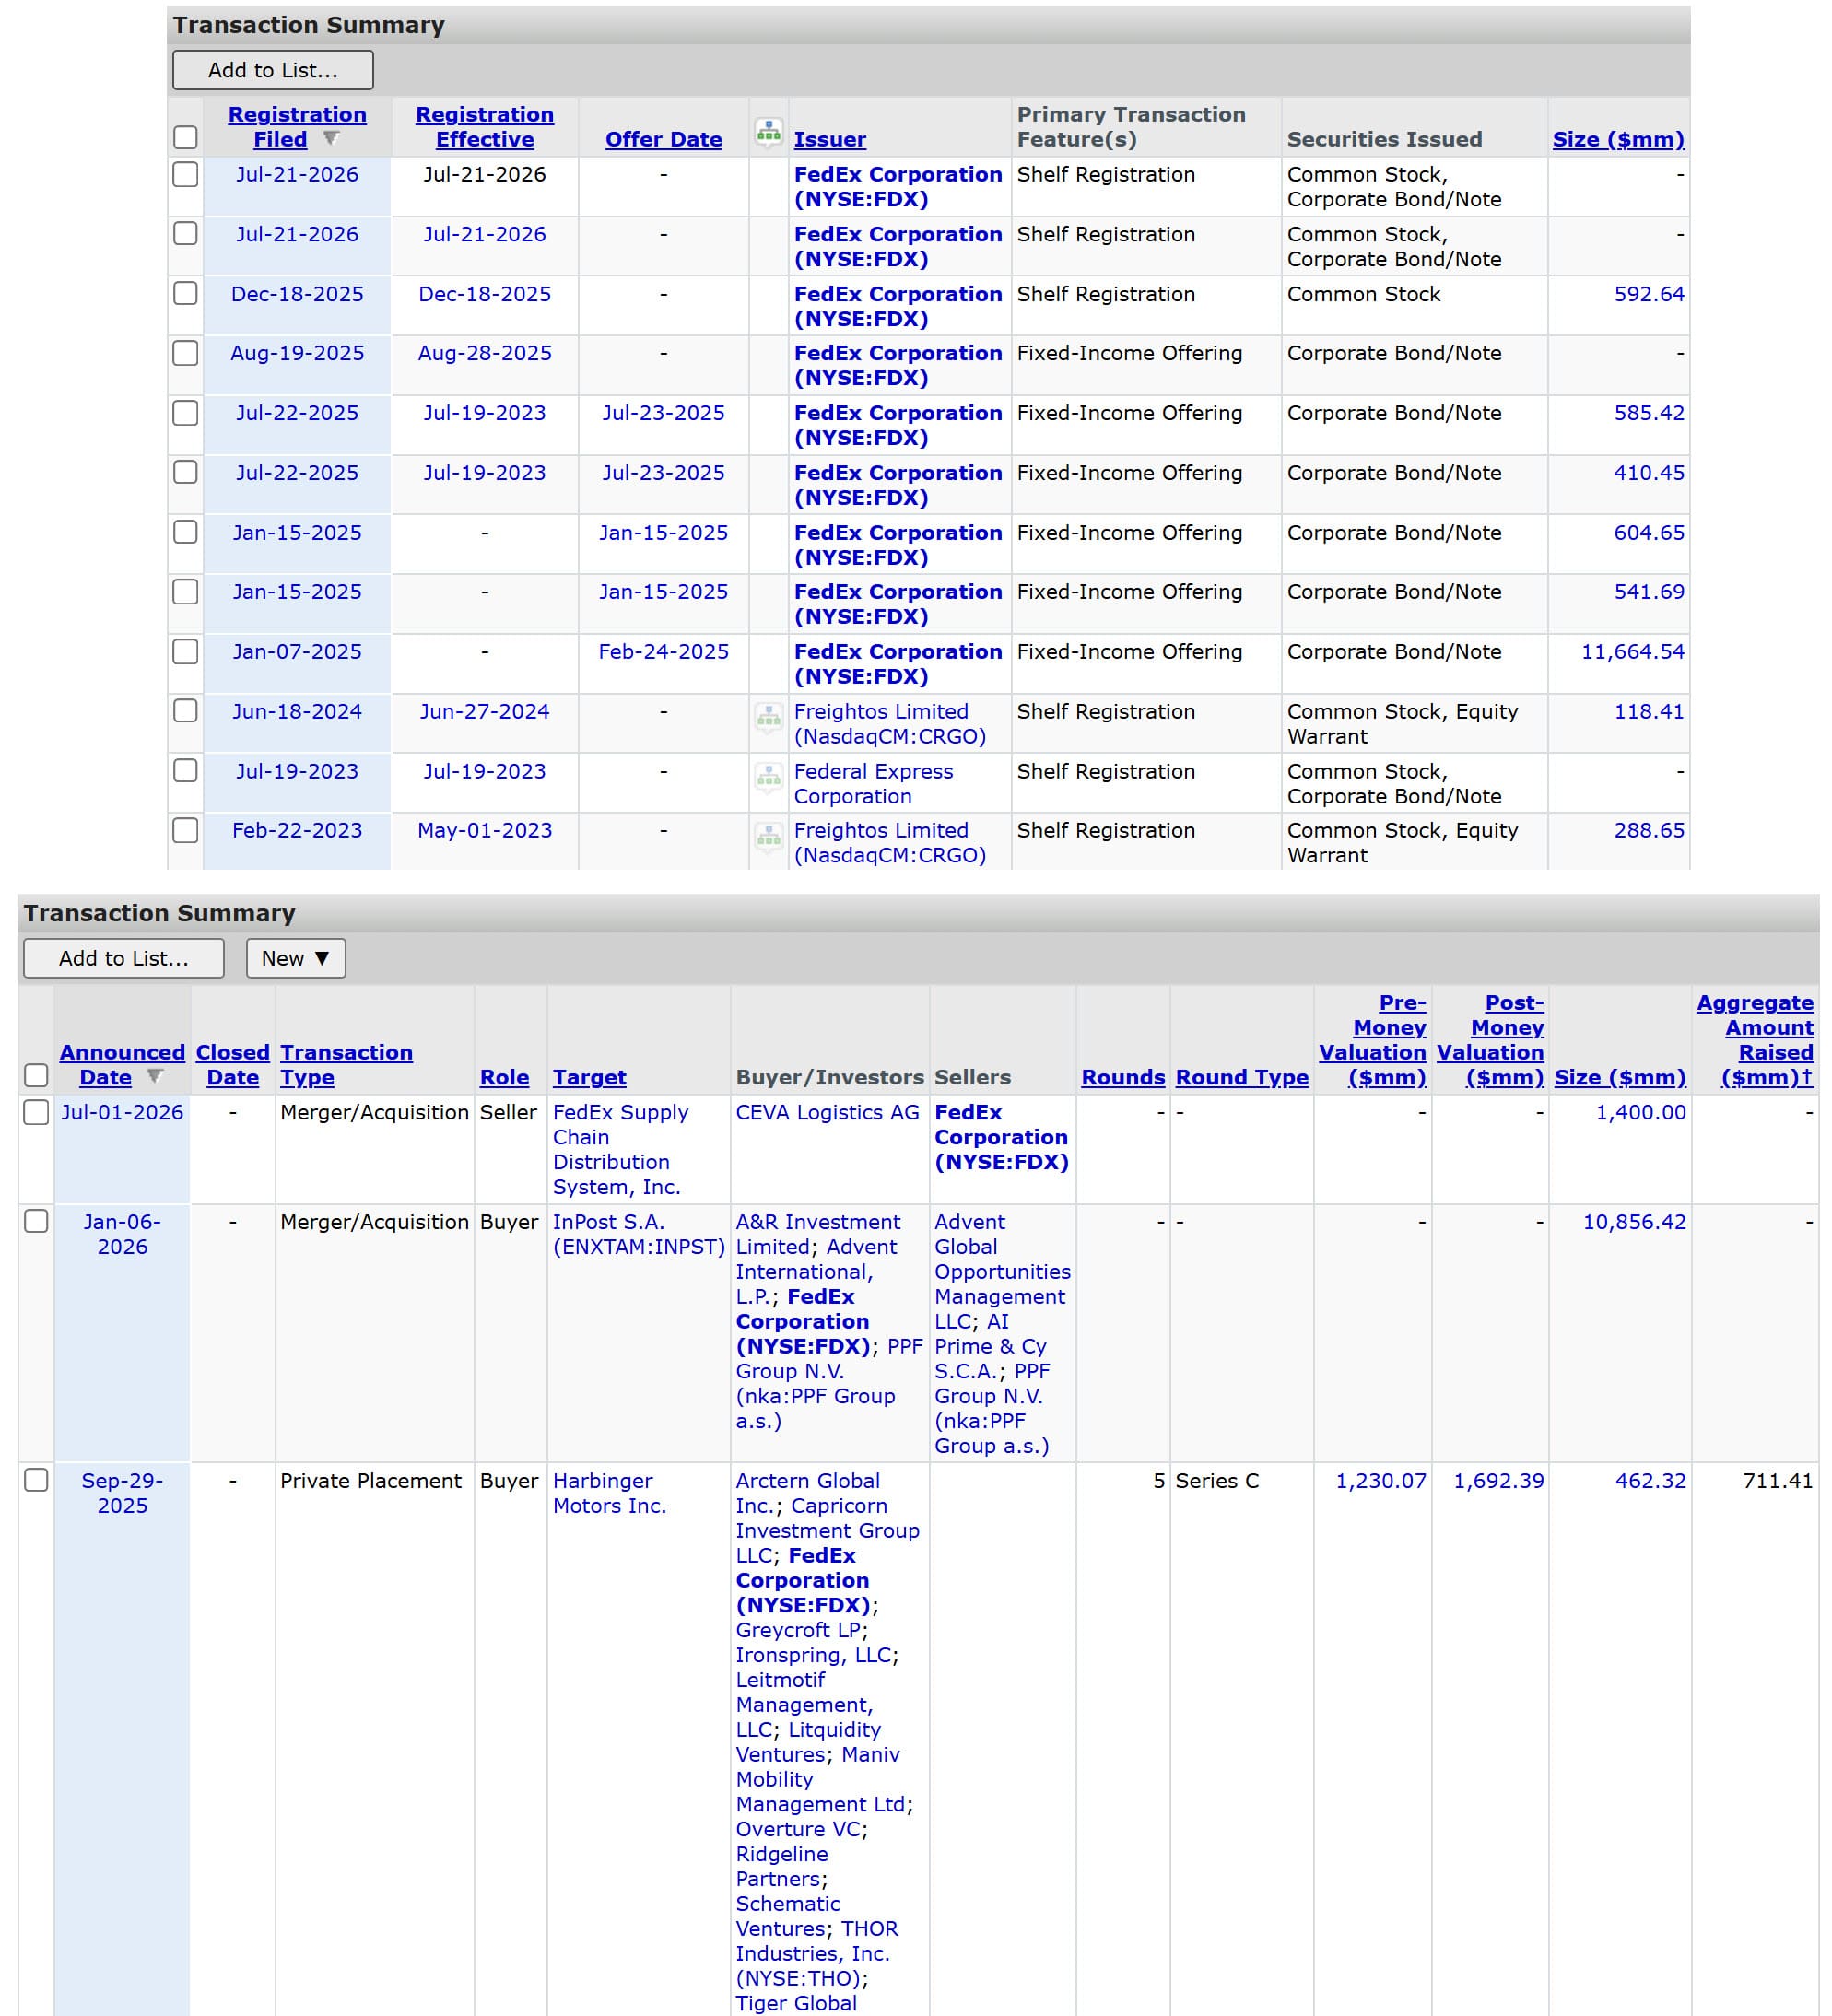
There’s a fair amount of M&A – though mostly smaller deals – a lot of debt offerings, and the occasional equity offering.
Since it’s a mature sector with mostly profitable and cash-flow-positive companies, debt issuances tend to be more common than equity.
And while there are occasional high-profile M&A deals worth $50 or $100+ billion (see below), smaller deals are still far more common.
There’s also a fair amount of divestiture activity in the sector, as companies often change their strategies and decide to focus on different regions or go “asset-light” or “asset-heavy,” depending on current trends.
Transportation Trends and Drivers
Many of the trends and drivers overlap with the ones in industrials, but there are some subtle differences:
- GDP Growth and Trade – If the overall economy is growing, chances are that imports and exports are also growing, which means transportation demand is going up. However, the mix of growth is very important, as some companies benefit more from imports than exports, and some benefit more from domestic trade.
- Demographics and Consumer Spending – Although only passenger airlines have individual consumers as direct customers, consumers influence everything else because they buy transported end products, such as food and fuel. Younger populations with higher growth and mobility are also more likely to drive transportation demand higher.
- Commodity Prices and Production Costs – Normally, companies in this sector benefit from lower energy, materials, and electricity prices, as they’re all key costs. However, some transportation companies may benefit or be “neutral” from rising prices. For example, a railroad company that transports iron ore could charge higher rates if iron prices increase, though rising fuel prices would still hurt them.
- Technology and Automation – All the advancements in self-driving vehicles and drones will affect companies in this sector, but some more than others (air freight is easier to “automate” and presents fewer legal liabilities than passenger airlines). Self-driving vehicles will shift companies’ budgets away from OpEx and toward CapEx, which affects their valuations and financing decisions.
- Government Spending, Incentives, and Tax Policies – Governments view many transportation and logistics companies and the assets they own as critical to national security, so they design policies to incentivize the construction and maintenance of these assets (in theory). Governments also award concessions to companies and determine which companies can serve specific routes and ports.
- Unions and Labor Relationships – Automation is picking up, but transportation companies still have massive workforces, and they’re often unionized in developed countries. Something like a workers’ strike might be a curiosity in another sector, but it could make a huge impact on passenger airlines and force companies to raise funds, do deals, or renegotiate contracts worth billions of dollars.
Transportation Investment Banking by Vertical
Here’s my summary of each vertical, along with some examples of KPIs and valuation metrics:
Air Freight & Logistics
Representative Public Companies: Deutsche Post, FedEx, UPS, Xiamen Xiangyu, S.F. Holding Co., DSV A/S, JD Logistics, Hyundai Glovis, C.H. Robinson Worldwide, and Nippon Express.
These companies focus on managing distribution networks across many regions.
A company like FedEx is capital-intensive because it directly owns many of its trucks, aircraft, and shipping facilities, while DSV in Denmark is asset-light because it does not own any ships or airplanes and maintains only a small fleet of ground vehicles.
Key metrics in this vertical include the air freight, sea freight, and road freight in tons and the sizes of companies’ logistics centers:
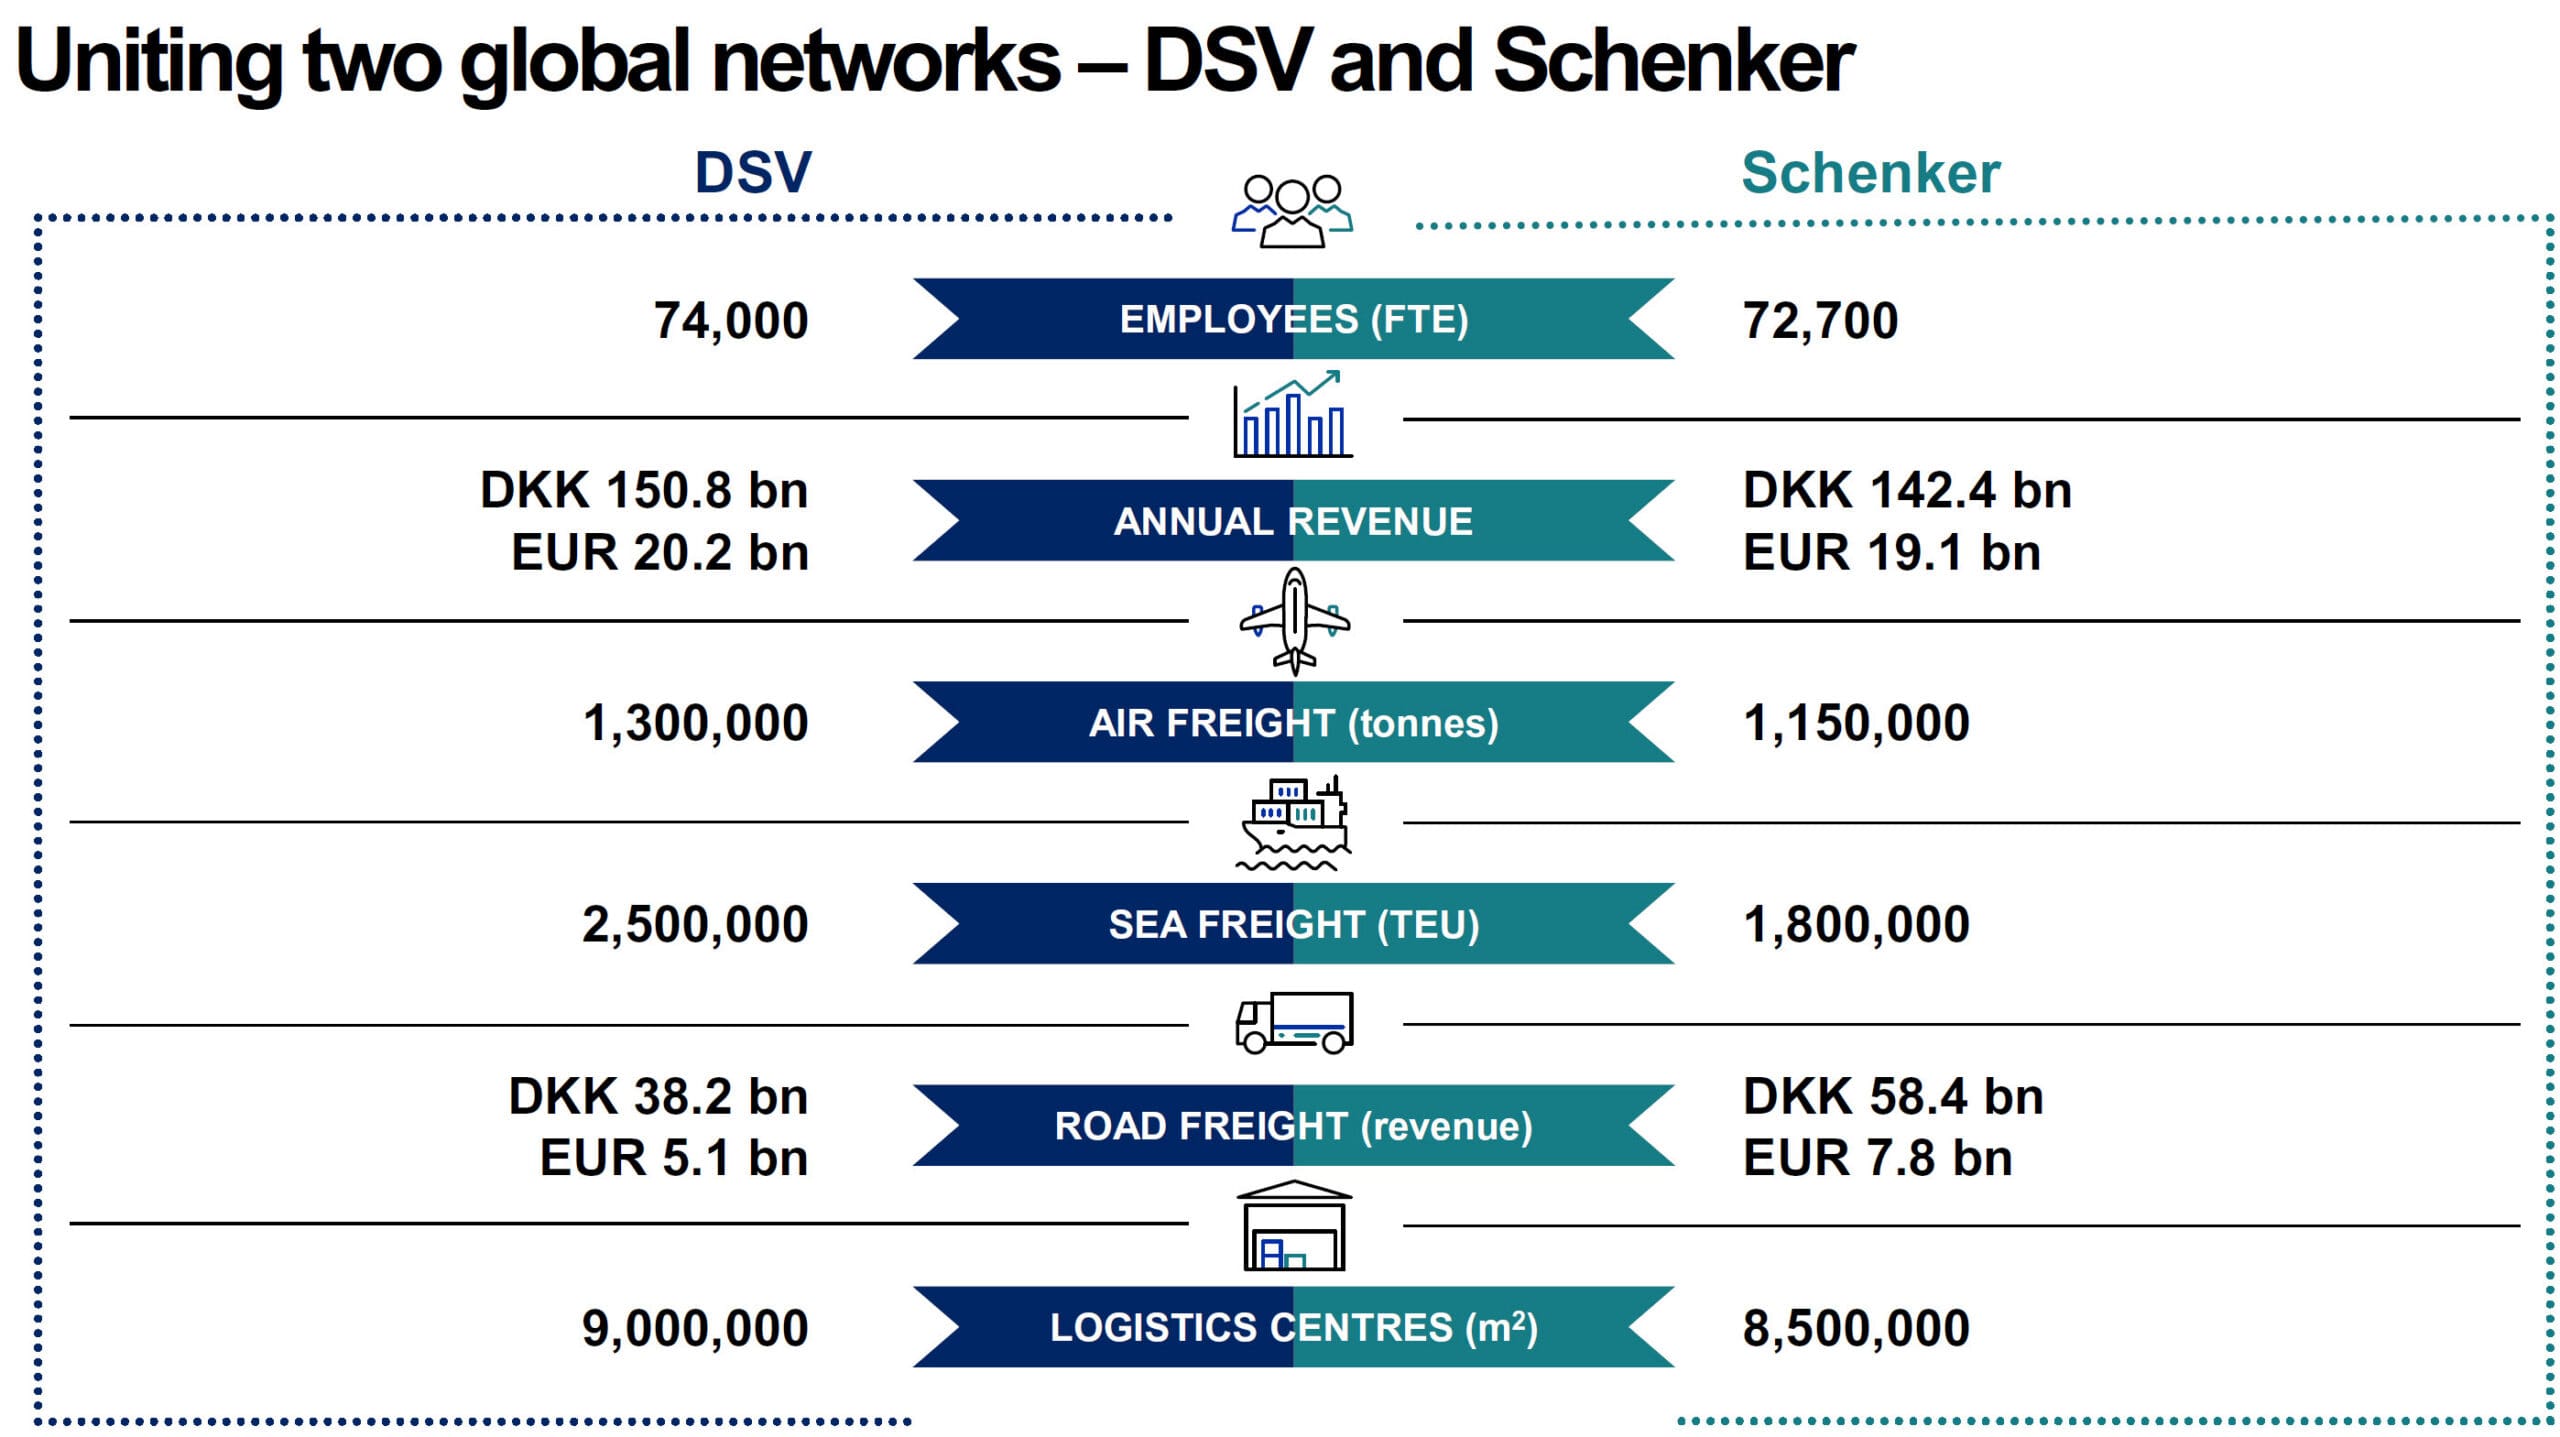
Revenue and expense forecasts depend on the average freight volume across each channel, the average price per ton, and the costs of labor, fuel, and maintenance.
Stats like the utilization rate of the companies’ networks are also vital for expenses and maintenance CapEx.
M&A deals are often motivated by companies wanting to diversify their freight types or gain market share in certain channels or regions.
Passenger Airlines
Representative Public Companies: Delta, United, American, Lufthansa, Air France-KLM, IAG (British Airways and Iberia), Southwest, China Southern, Air China, Turkish Air, China Eastern, Ryanair, Korean Air, and Air Canada.
Airlines differ from all the other verticals in industrials because their end customers are mostly consumers rather than businesses.
They get passengers (and some freight) from Point A to Point B; expect detours to Points C and D if you’re on a U.S. airline and your flight inevitably gets canceled.
Most passenger airlines are headquartered in a specific city that acts as the “hub” of their wheel. The spokes on that wheel represent all the outbound routes to other cities in the country and to other countries, if the firm operates internationally.
Concessions, competition, and routes play a huge role in analyzing airlines because federal, state, and local governments determine which companies have the rights to gates at specific airports.
M&A deals in the sector are often motivated by access to specific routes and the ability to gain traffic and pricing advantages by combining:
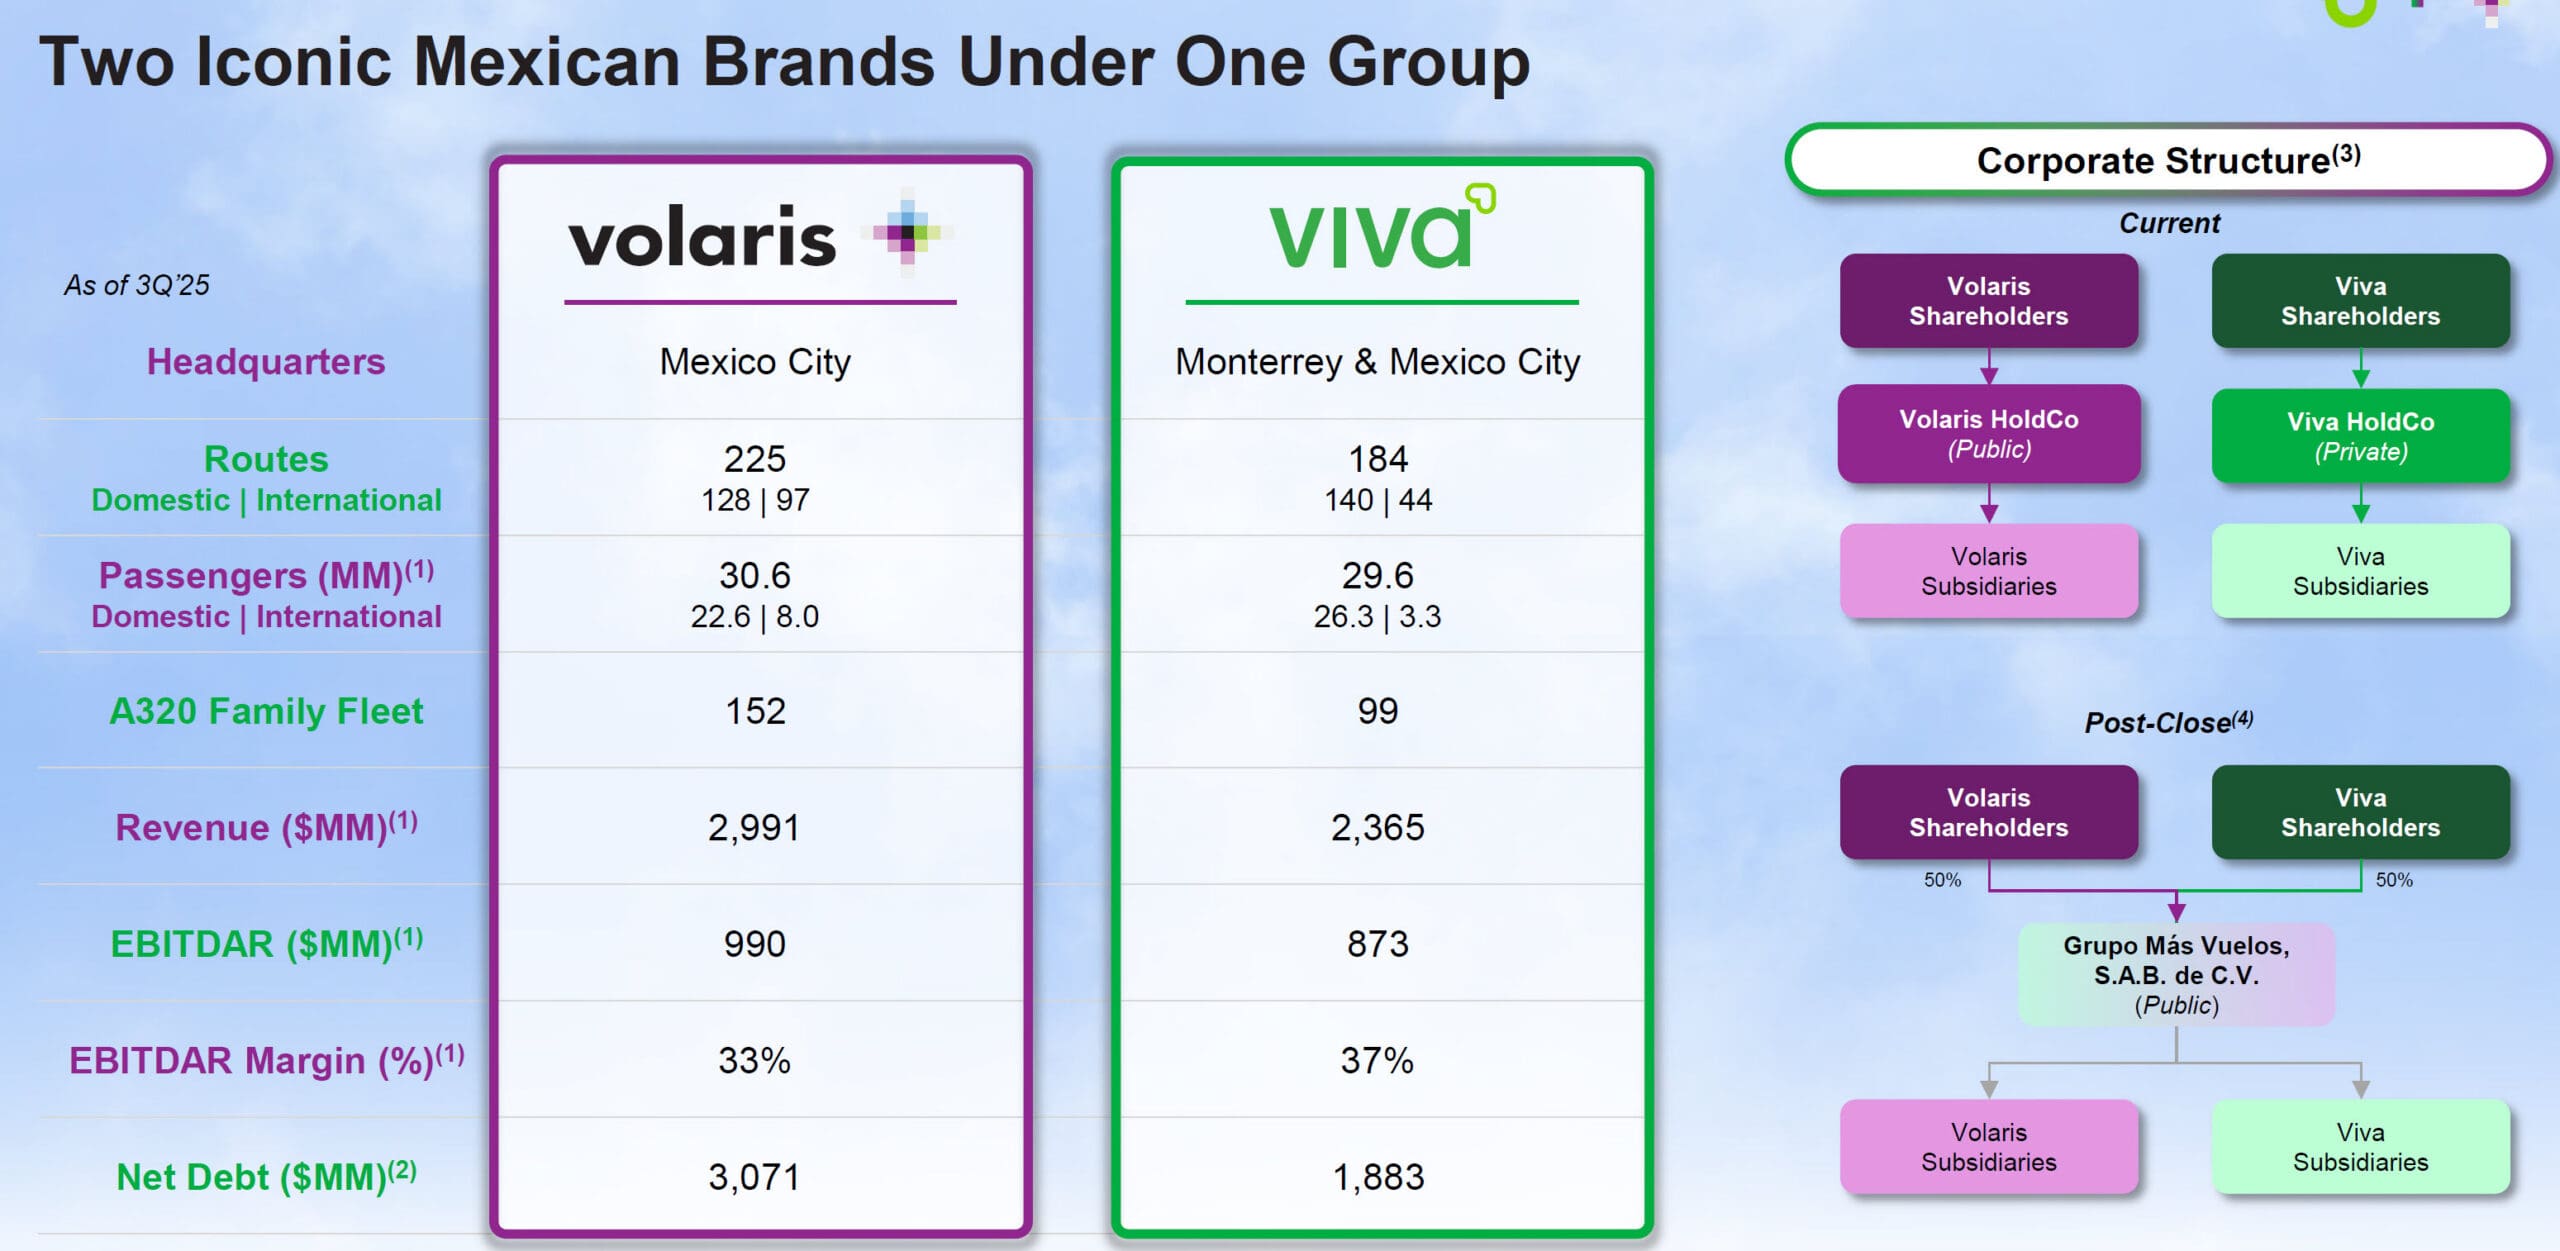
Key airline metrics include:
- Available Seat Miles (ASM) or Available Seat Kilometers (ASK)
- Load Factor
- Revenue Passenger Miles (RSM) or Revenue Passenger Kilometers (RSK)
- Fuel Expense and Operating Expense per ASM or ASK
- Passenger Yield
Available Seat Miles are the airline’s “total capacity.”
If it has 10 planes that each fly 2,000 miles per day, and each plane has 300 seats, then the daily ASM are 10 * 2,000 * 300 = 6 million, and the annual ASM are 6 million * 365 = 2.2 billion.
The Load Factor tells you the percentage of seats that are occupied, and Revenue Passenger Miles = Available Seat Miles * Load Factor.
So, if this airline’s Load Factor is 85%, Revenue Passenger Miles = 2.2 billion * 85% = 1.9 billion.
The Passenger Yield tells you how much the airline makes for each RSM or RPK, and Passenger Revenue = Passenger Yield * RSM.
If this airline’s Passenger Yield is $0.10, then its Passenger Revenue = $0.10 * 1.9 billion = $190 million.
You also factor in revenue from cargo, baggage fees, and other sources, but those are the basics.
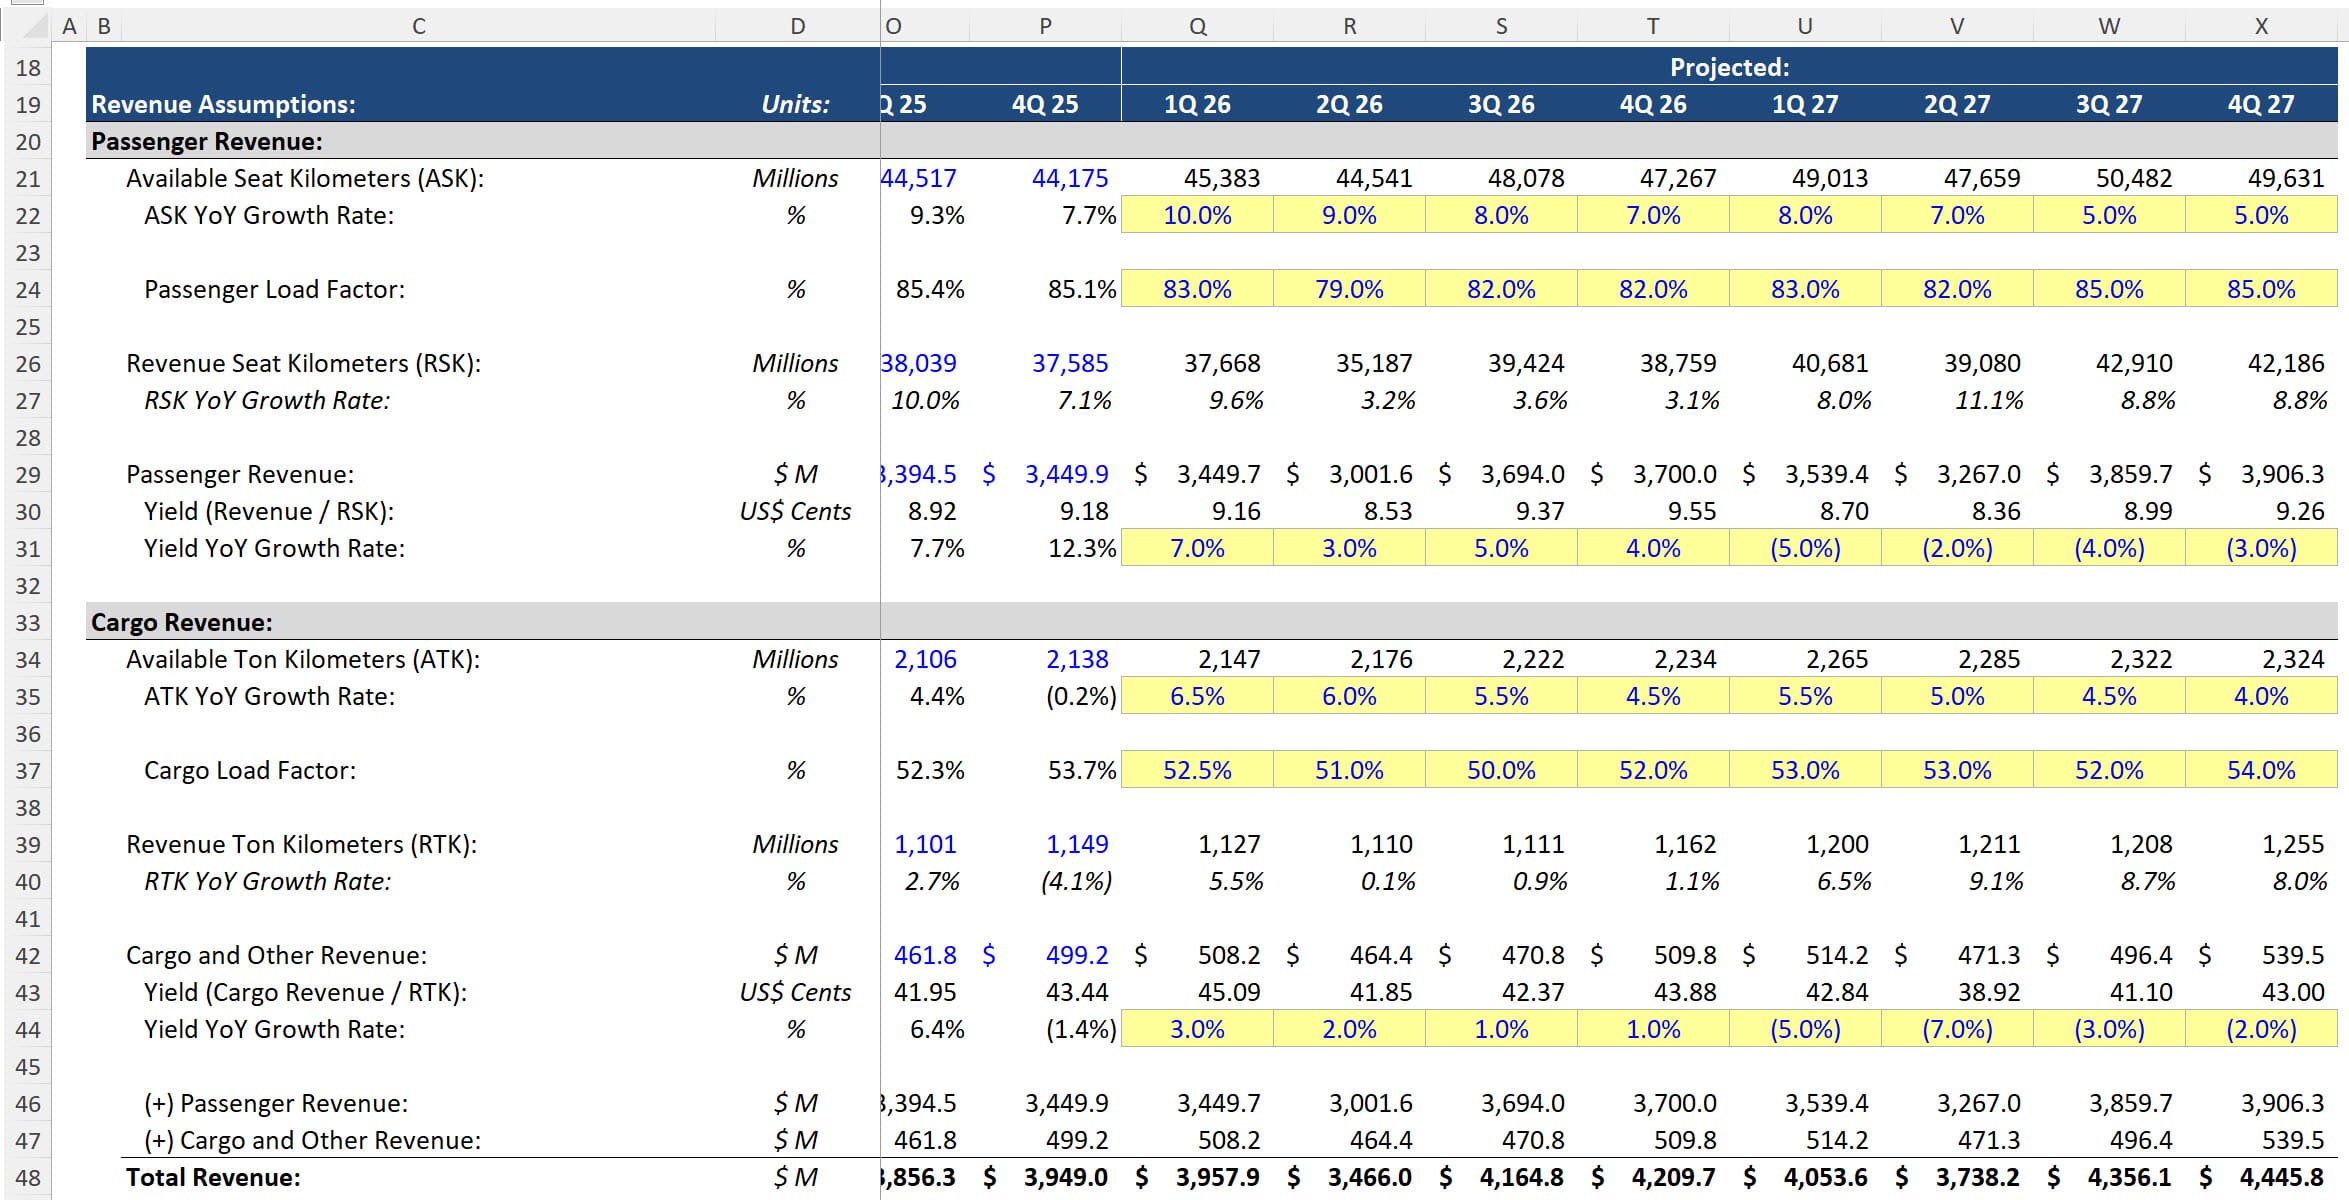
Here’s an example of quarterly forecasts based on LATAM Airlines during a fuel-price shock (covered in our IB Interview Guide):
Marine Transportation
Representative Public Companies: A.P. Moller – Maersk A/S, COSCO Shipping, Kuehne + Nagel International, Hapag-Lloyd, Nippon Yusen, Mitsui O.S.K. Lines, Evergreen Marine, Orient Overseas, HMM, and Kawasaki Kisen.
Companies in the maritime sector own fleets of ships that transport goods and commodities over key trade routes.
Different companies specialize in different vessel types: There are oil tankers, gas carriers, dry bulk (mostly for commodities), and containerships (both commodities and finished goods), along with cruise ships on the passenger side.
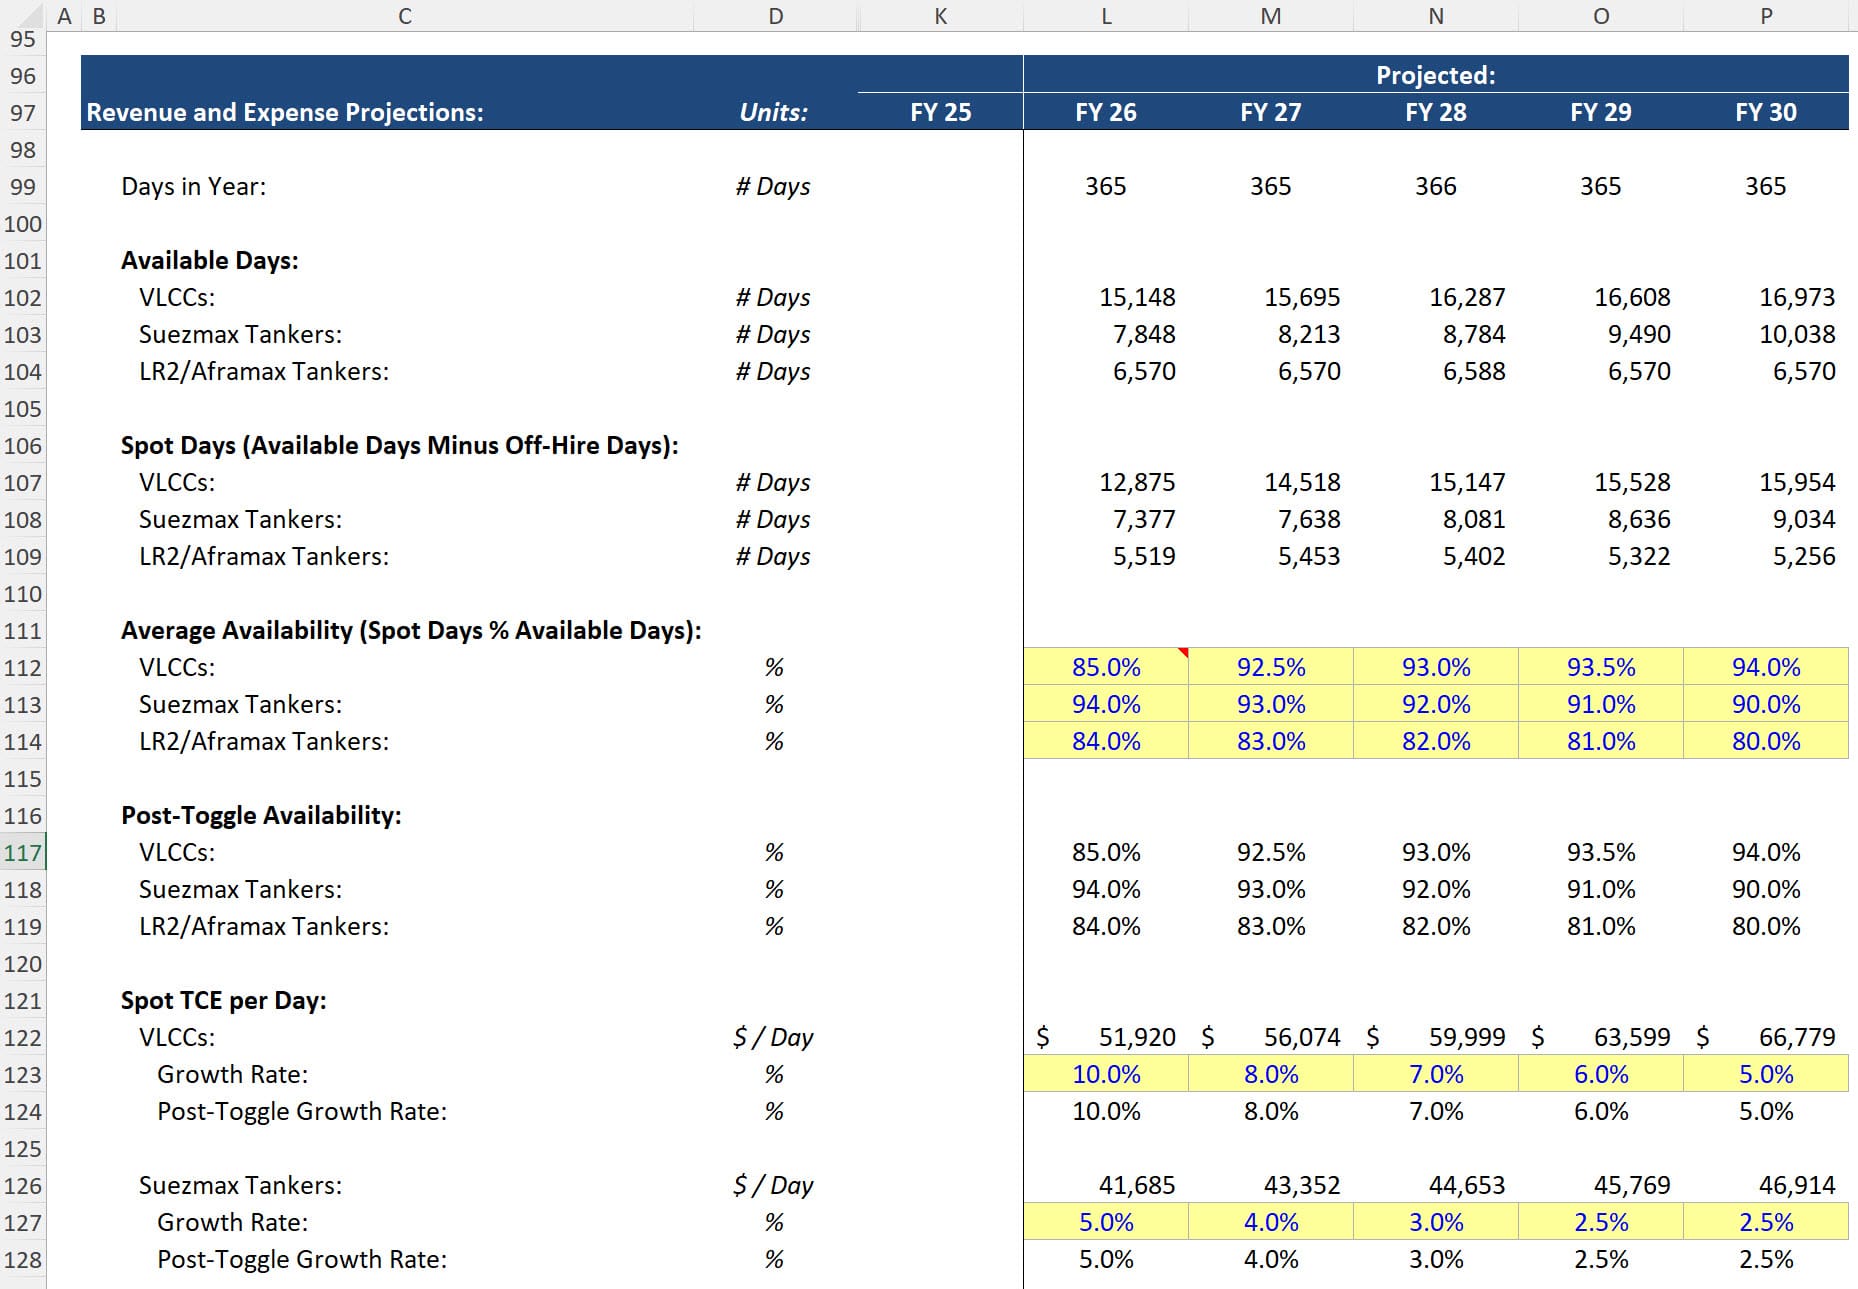
Revenue = # Vessels * Available Days per Year * Daily Rate, but there’s nuance to it because this “Daily Rate” could be based on spot market prices or more of a longer-term, locked-in price based on contracts:
Also, each vessel type has a different expense profile and different CapEx requirements.
If you analyze companies in this vertical, you’ll think about:
- The cargo types the company transports.
- The vessel types and their similarities/differences, ages, and overall capacity (a fleet of mostly the same vessels simplifies operational matters but also creates more concentration risk).
- Average contract length and terms, including spot vs. charter rates.
- Accessible ports and the routes the company can access.
- OpEx and CapEx requirements on a per-vessel basis.
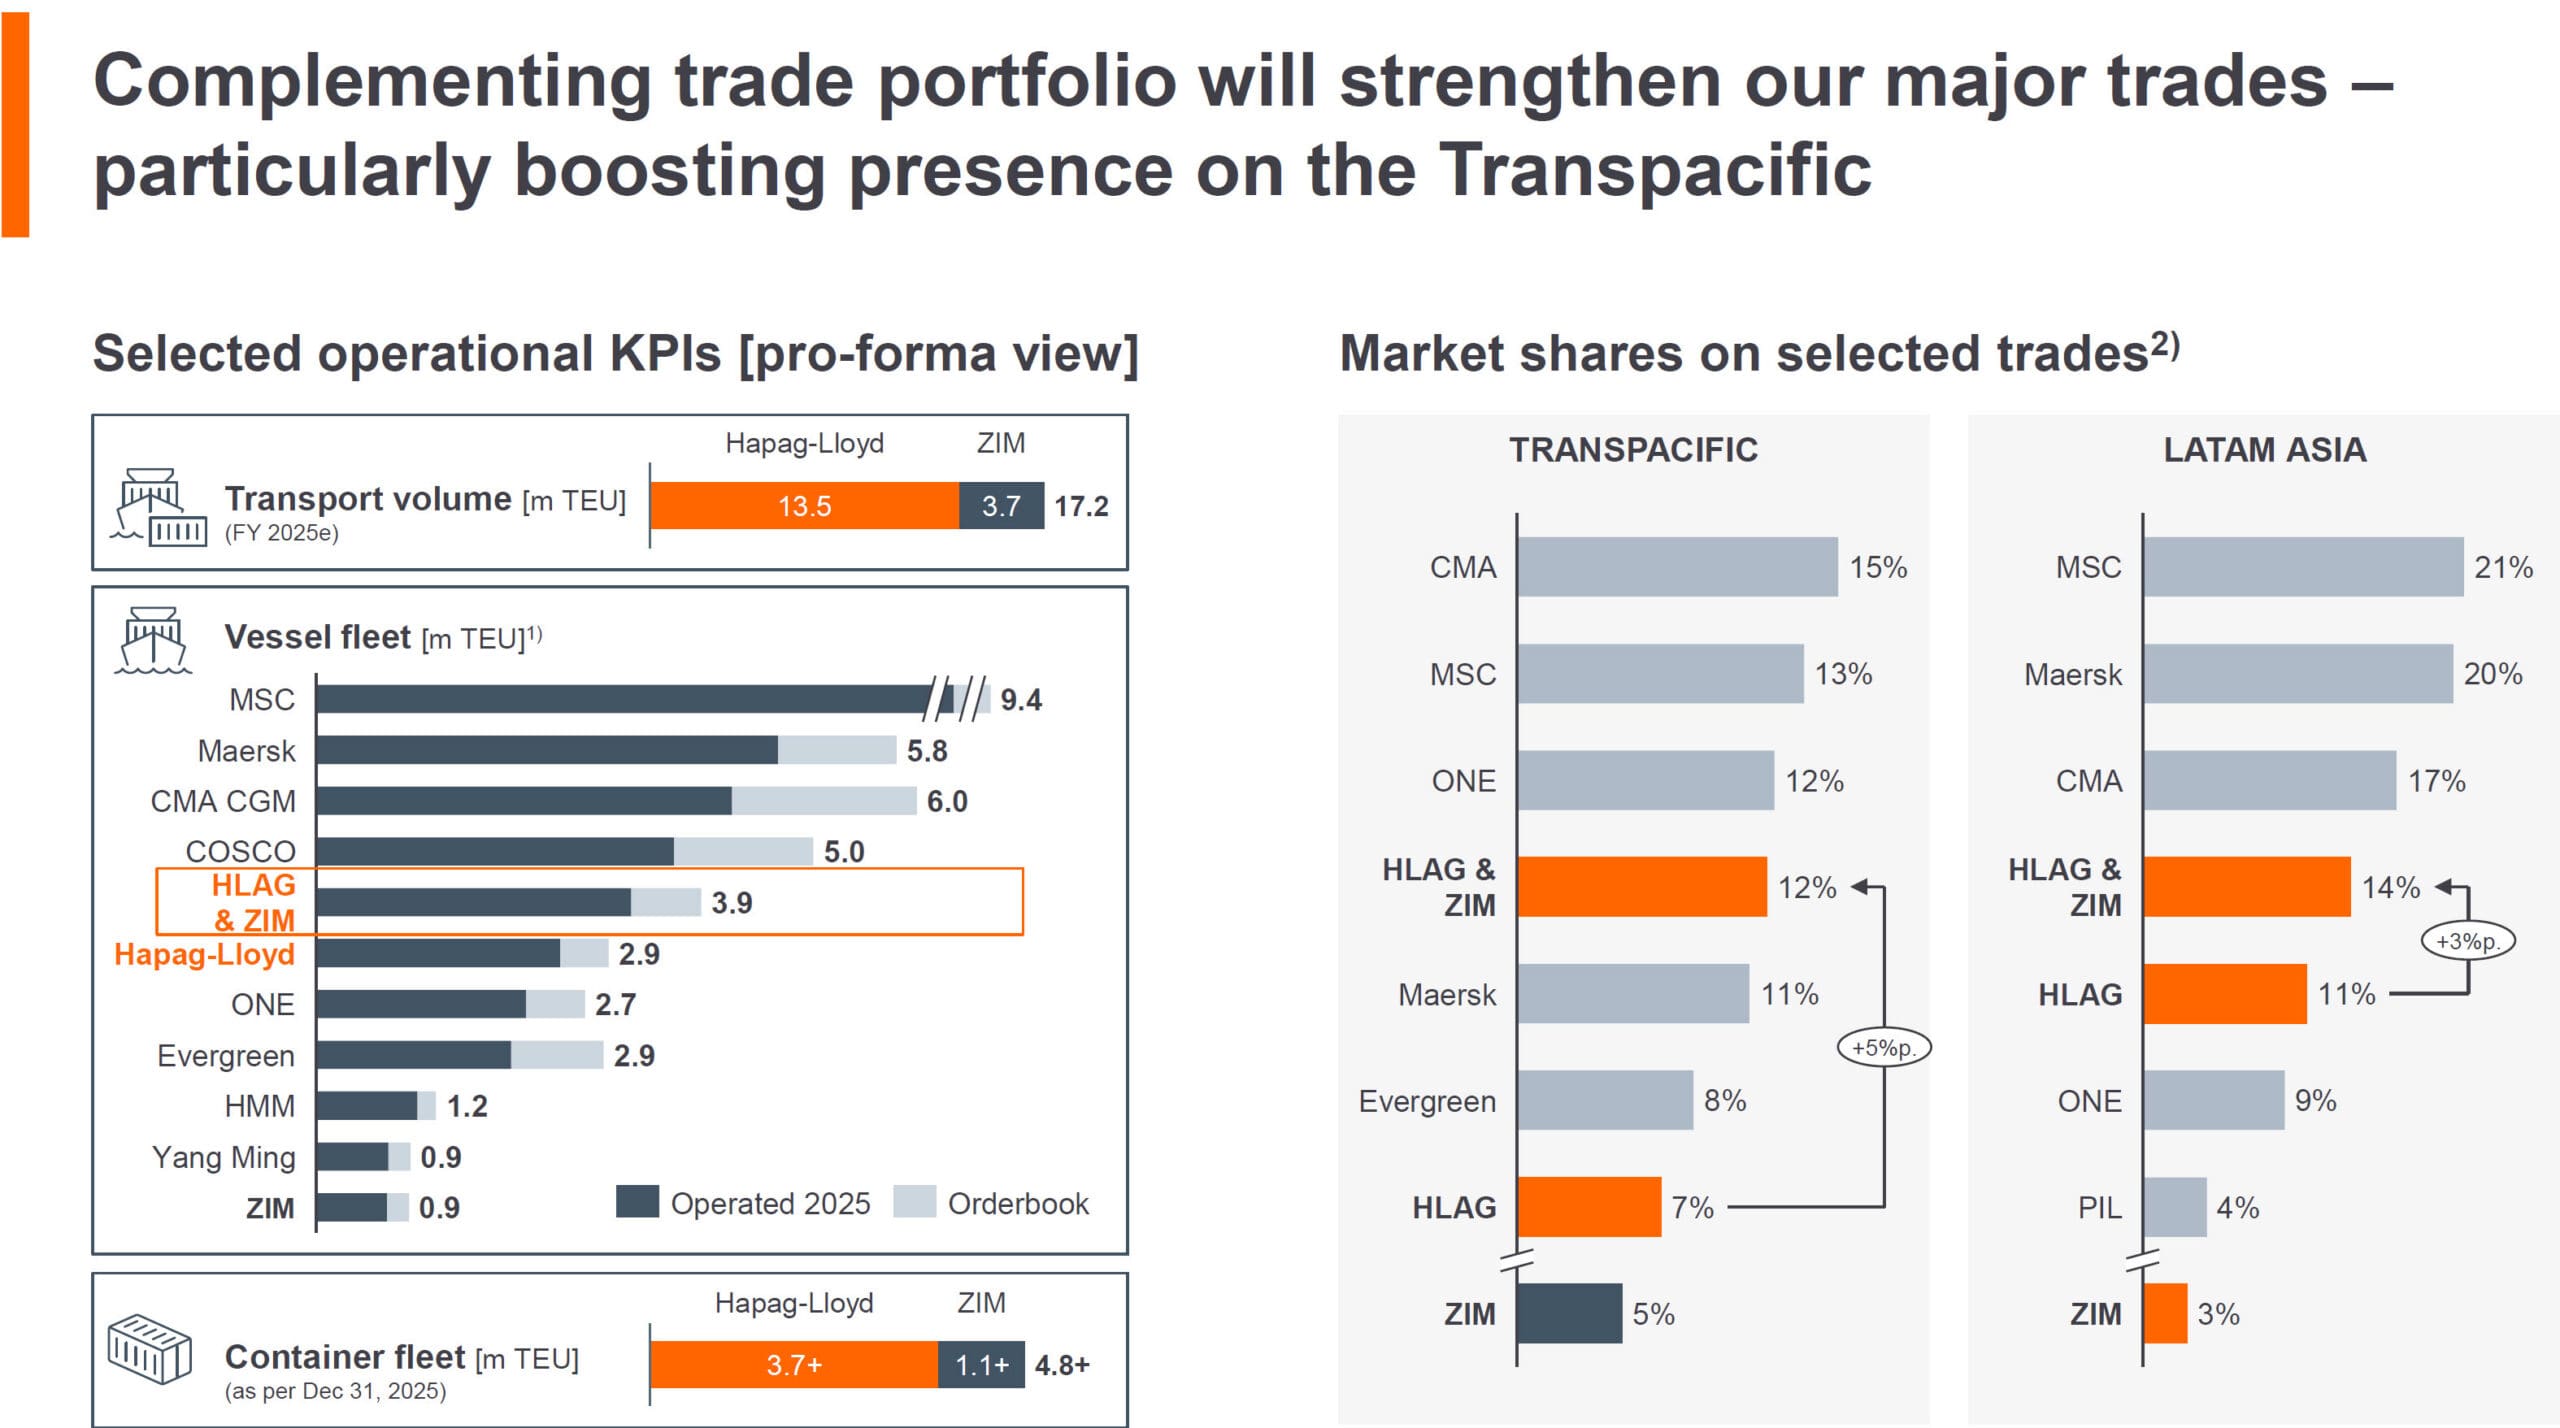
M&A deals are often motivated by one company wanting to diversify its cargo or routes or gain market share in specific regions:
Sometimes, maritime companies also move in the opposite direction and execute divestitures and spinoffs to simplify their fleets and improve their profitability, cash flows, and ROIC.
Ground Transportation
Representative Public Companies: Uber, DiDi Global, Ayvens, Union Pacific, East Japan Railway, CSX, Ryder Systems, J.B. Hunt Transport Services, Central Japan Railway, Norfolk Southern, Canadian National Railway, and Avis Budget Group.
Traditionally, ground transportation companies have served other businesses, but this is less accurate now, as companies such as Uber and DiDi have joined this list.
You can divide railroad and trucking companies into passenger vs. freight and, on the rail side, into regional vs. local operators, with regional operators linking multiple urban corridors.
Key metrics in this vertical include:
- Route Miles or Kilometers: The best measure of the company’s “overall capacity.”
- Average Length of Haul and Average # of Cars: Trips of different lengths and vehicles of different sizes have different weekly earnings and expenses.
- Average Fleet Age: This directly affects maintenance costs, CapEx, and eventual replacement needs.
- Operating Ratio: Operating Expenses / Revenue * 100. Commonly used in trucking, with a “normal” range between 85 and 95, and a desirable one under 85.
- Business Mix: Basic categories might include bulk, merchandise, and intermodal (freight containers moved via both trains and trucks without opening the cargo).
- # Employees: And for trucking companies, are the employees owner-operators with equity or “company drivers”? There are trade-offs to each one (e.g., more expenses can be passed through to owner-operators, but they also command higher compensation).
M&A deals in this vertical are often motivated by regional expansion opportunities and route diversification:
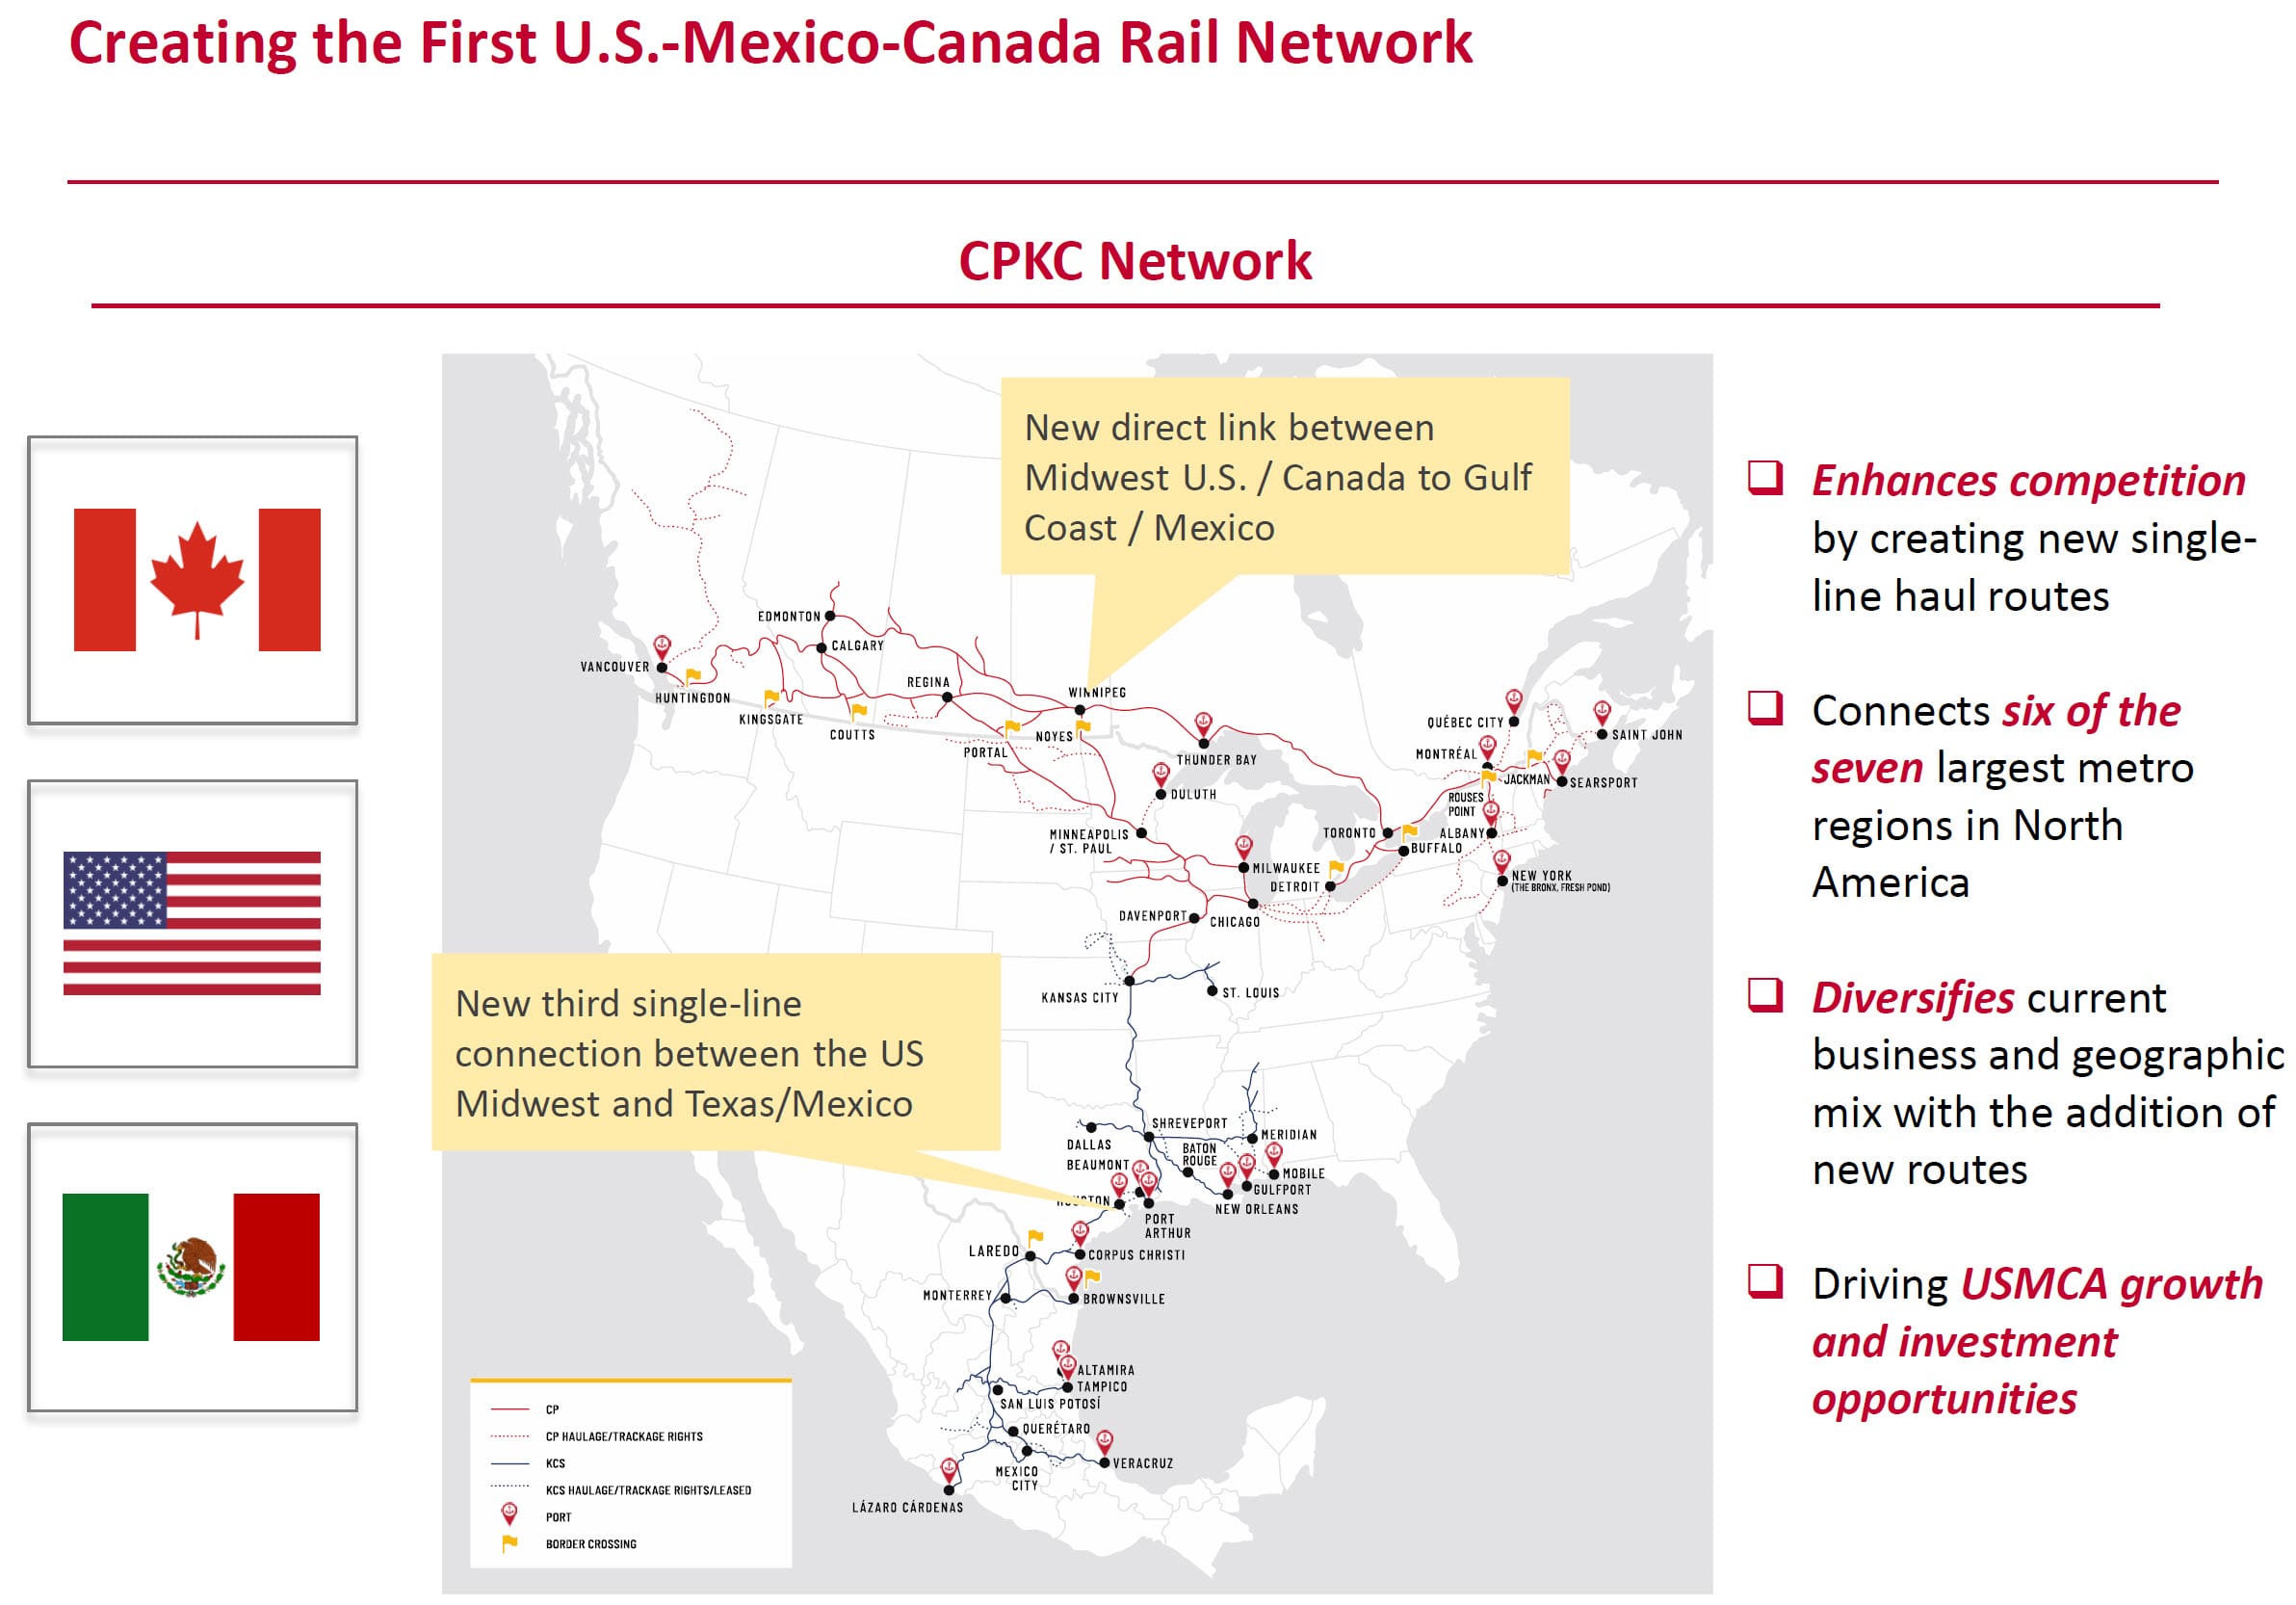
Since rail is a mature sector, it produces quite a few high-profile mega-deals since the companies involved are already quite large (see below).
Transportation Accounting, Valuation, and Financial Modeling
For the most part, the accounting, valuation, and financial modeling in the transportation sector are quite standardized.
You’ll see EBITDA and P / E multiples and DCF models in many presentations and Fairness Opinions, with the main differences being the KPIs and drivers:
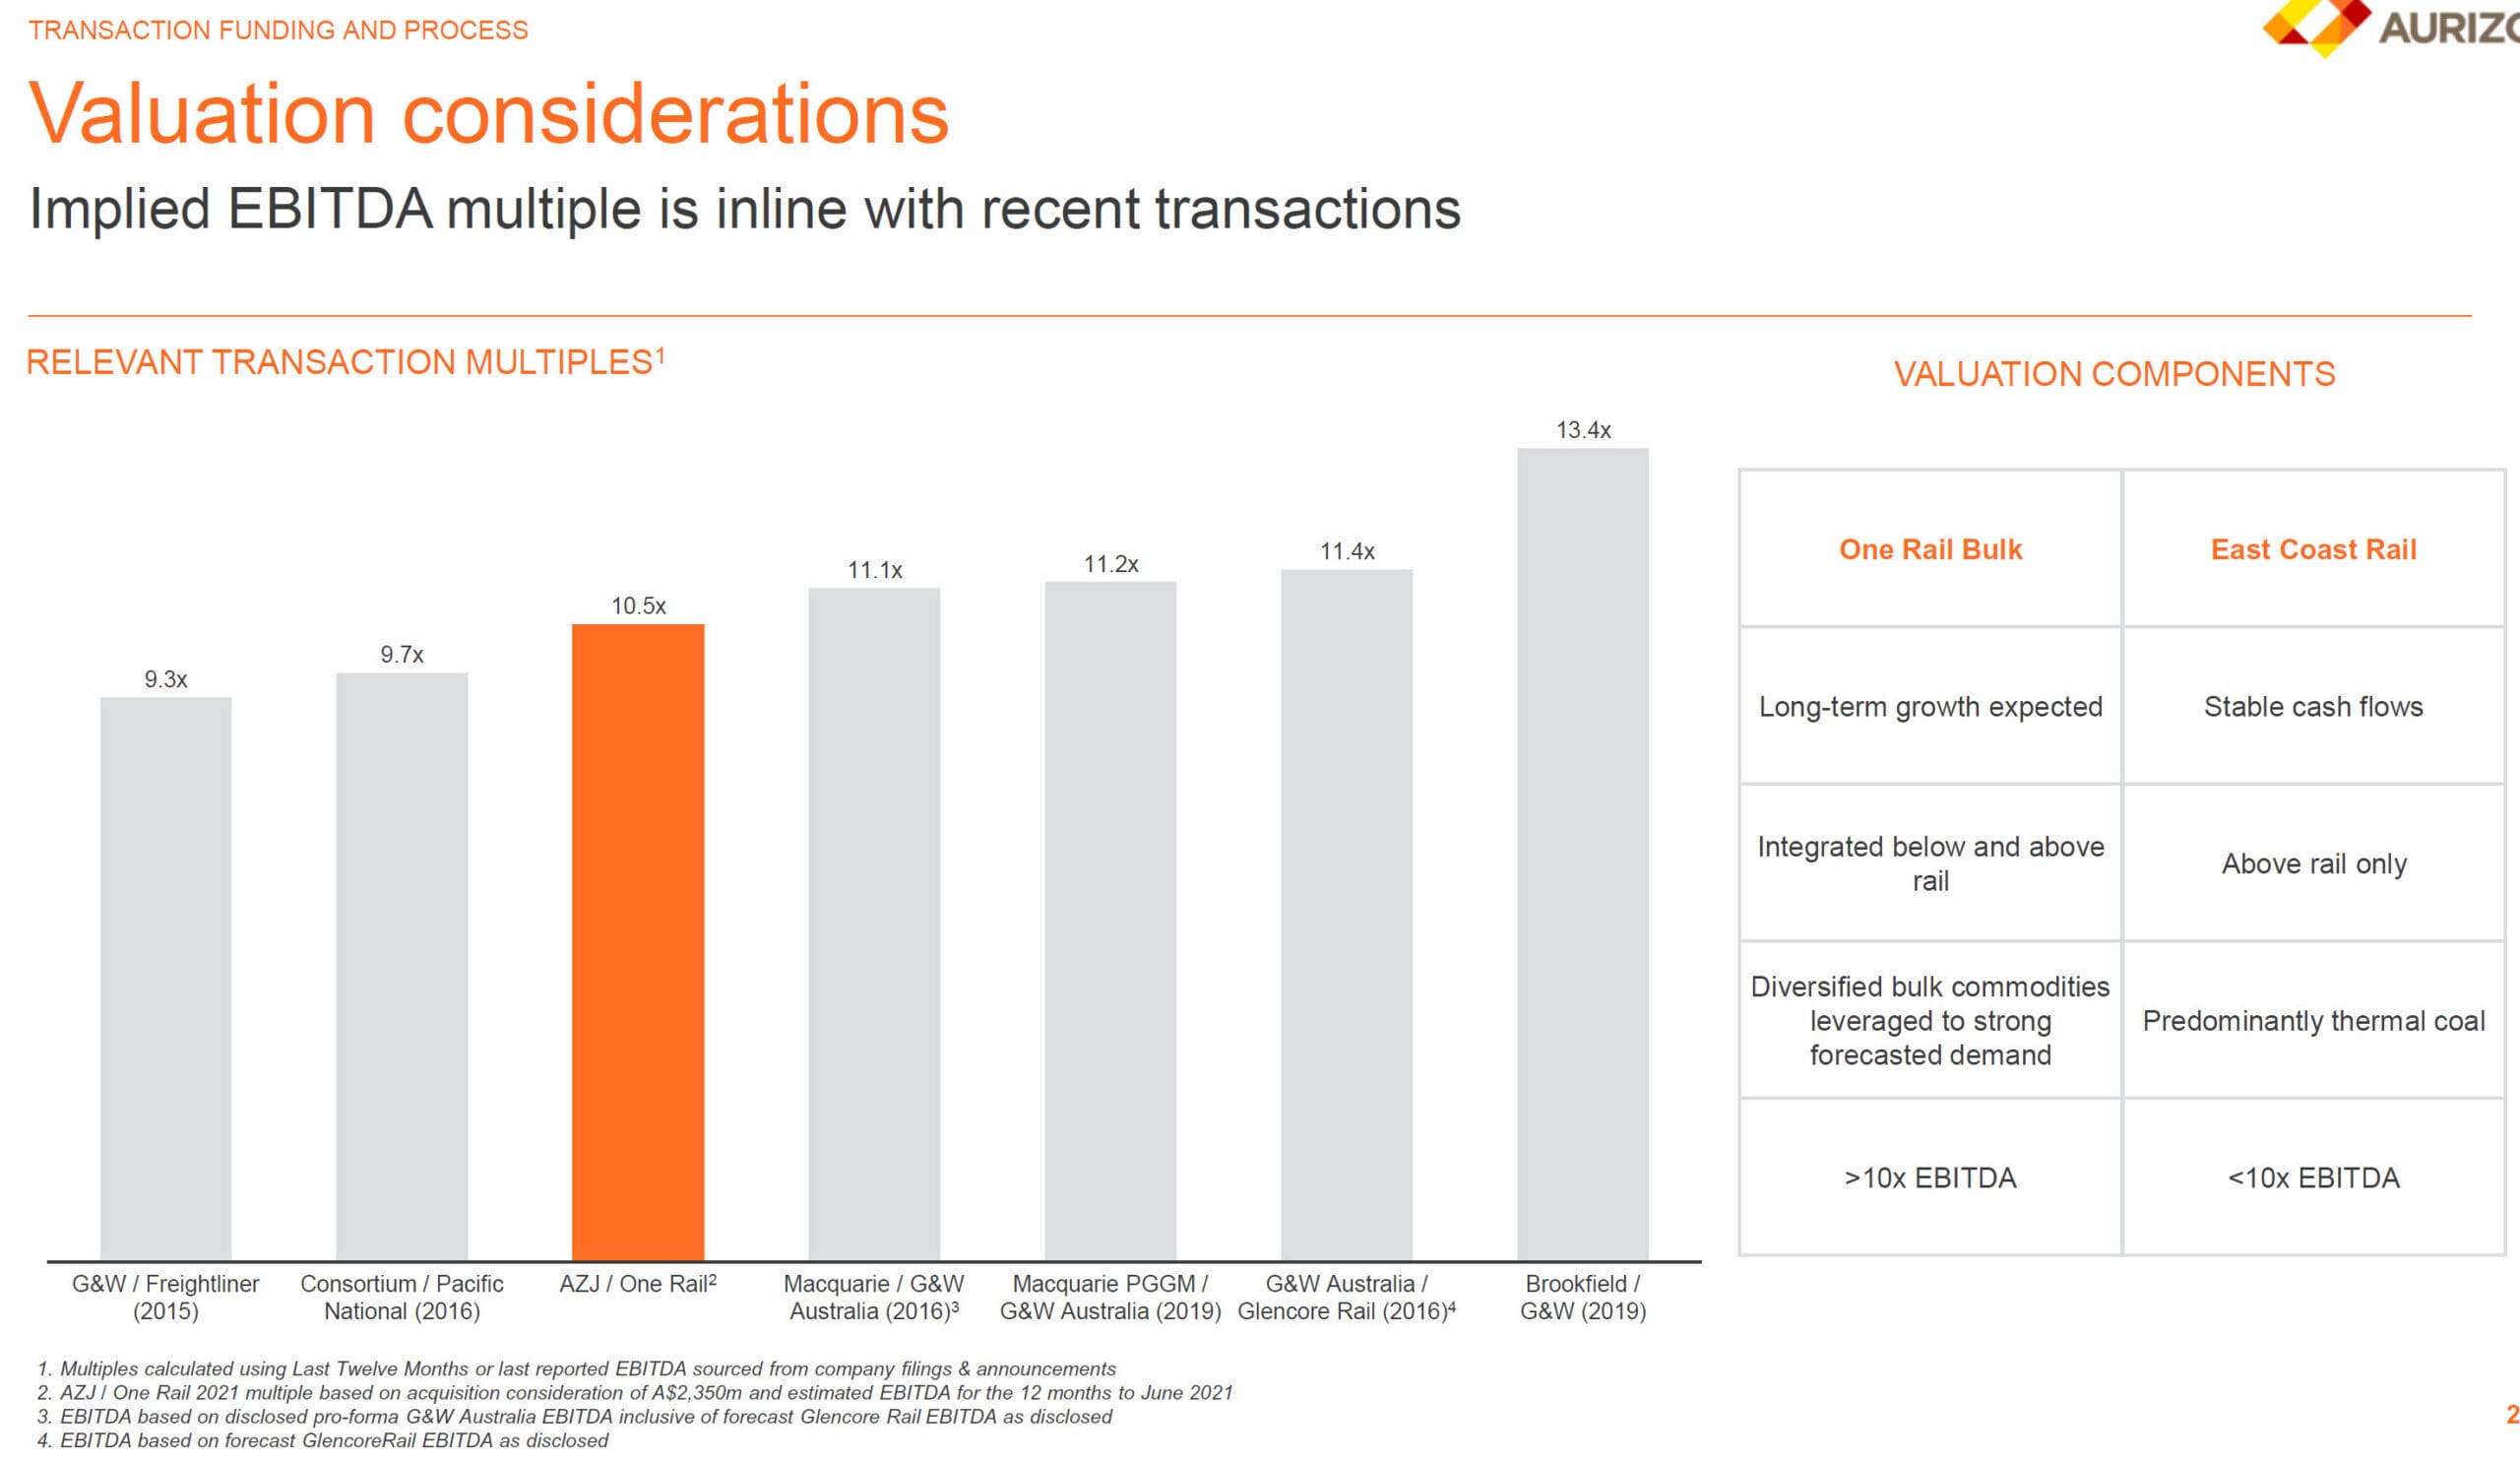
Most of the valuation differences are in the maritime sector.
As shown in the ZIM Fairness Opinion below, you’ll often see multiples such as P / BV and EV / IC (Enterprise Value / Invested Capital):
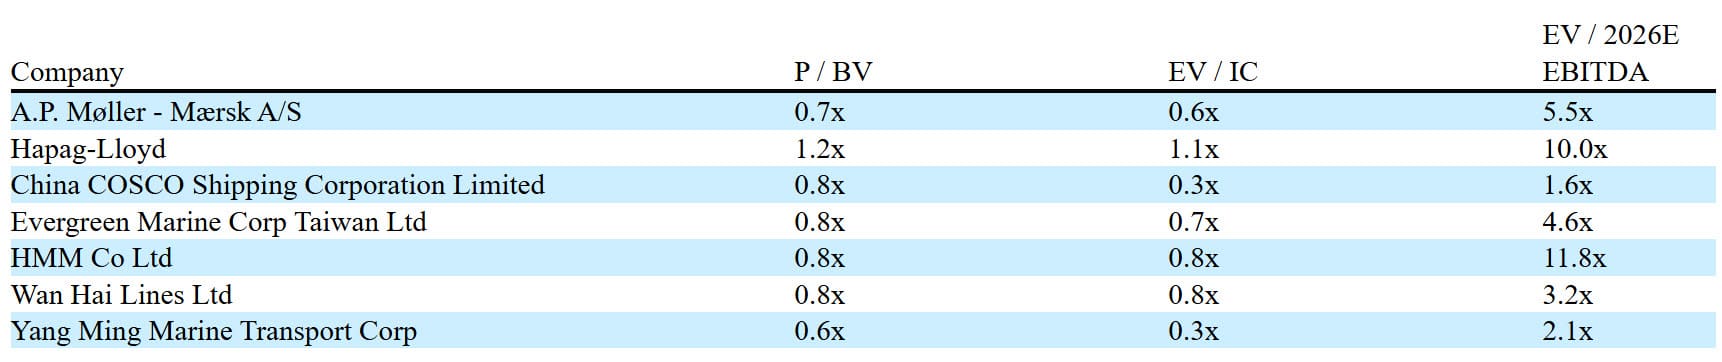
The logic is that maritime companies are valued primarily based on their fleets, which comprise most of their Balance Sheets, so it’s reasonable to use Balance Sheet-based multiples.
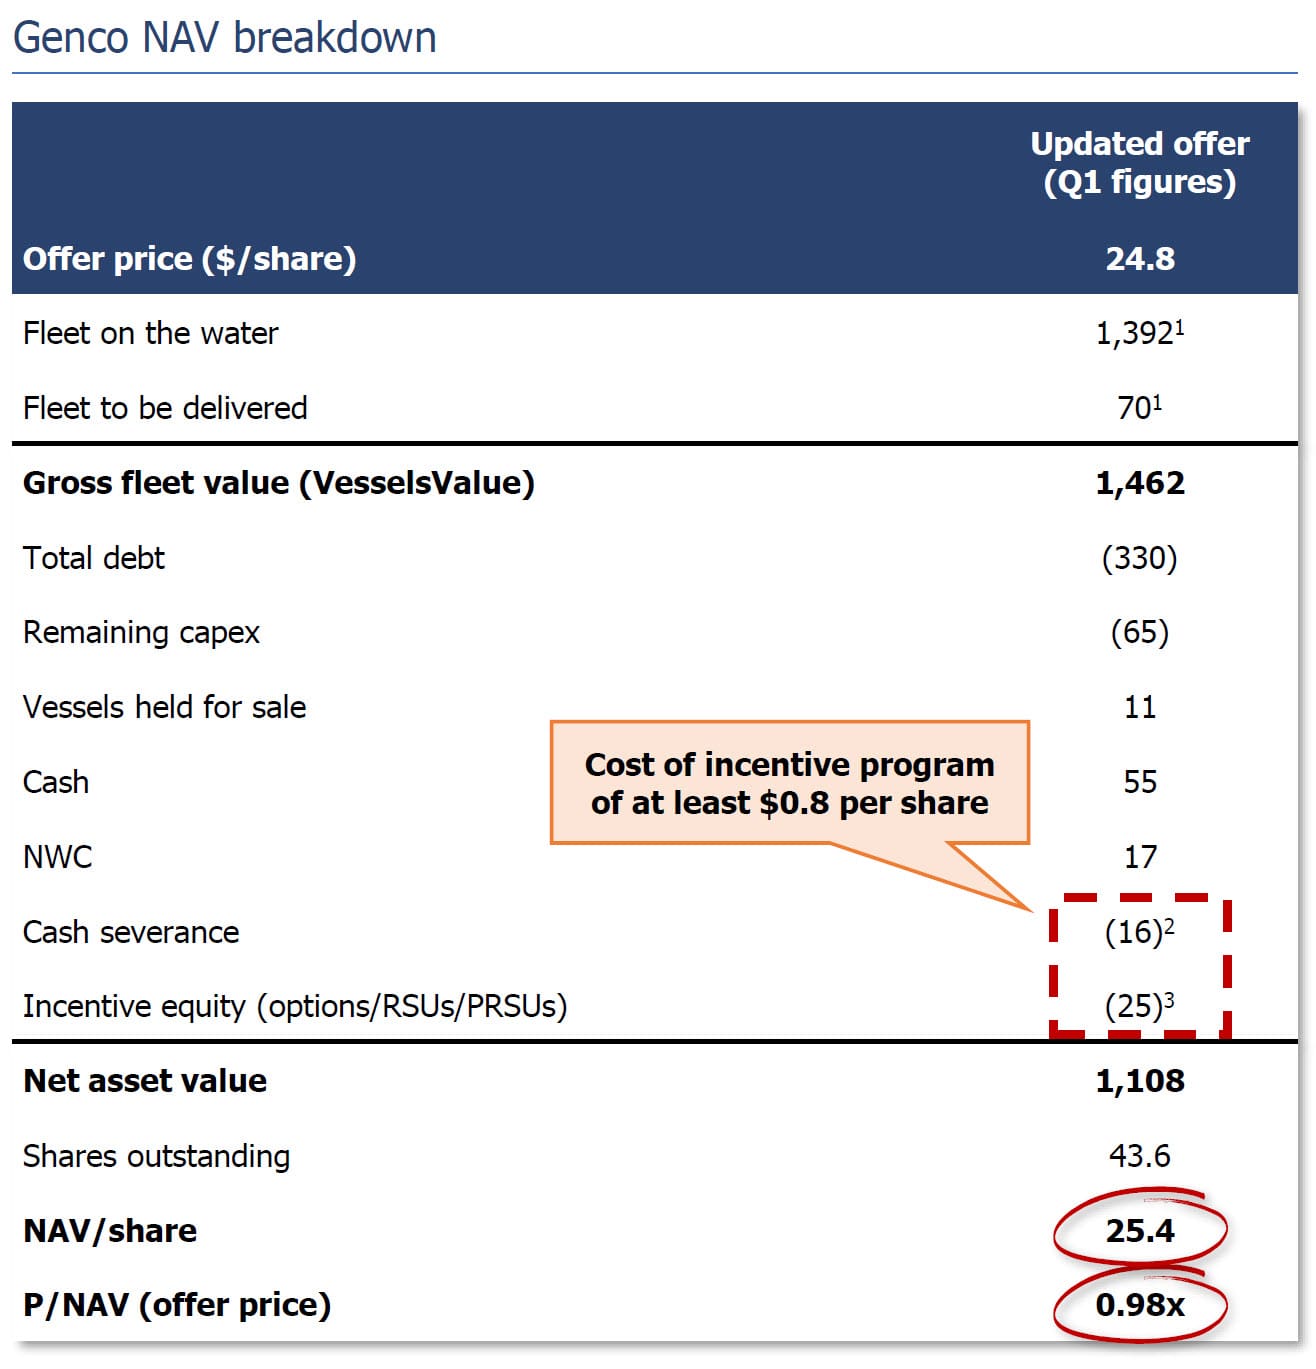
This also explains why you’ll see the Net Asset Value (NAV) methodology applied to maritime companies; it’s slightly different from the version used in oil & gas, mining, and real estate, but you can see the basic setup below for Genco:
Sometimes, companies in this vertical also use “Distributable Cash Flow” (DCF) as a metric, which equals EBITDA – CapEx, under the logic that CapEx is so significant that you cannot just “ignore it” in the multiples.
Outside of these points, a few other differences across the verticals include:
1) Leases and EBITDAR – Assets such as vehicles, vessels, and planes are very important in this sector, but leasing and ownership policies vary widely, and cross-border deals with companies that follow different accounting systems are common.
Therefore, to normalize these differences, metrics such as EBITDAR and valuation multiples such as Enterprise Value Including All Lease Liabilities / EBITDAR are common:
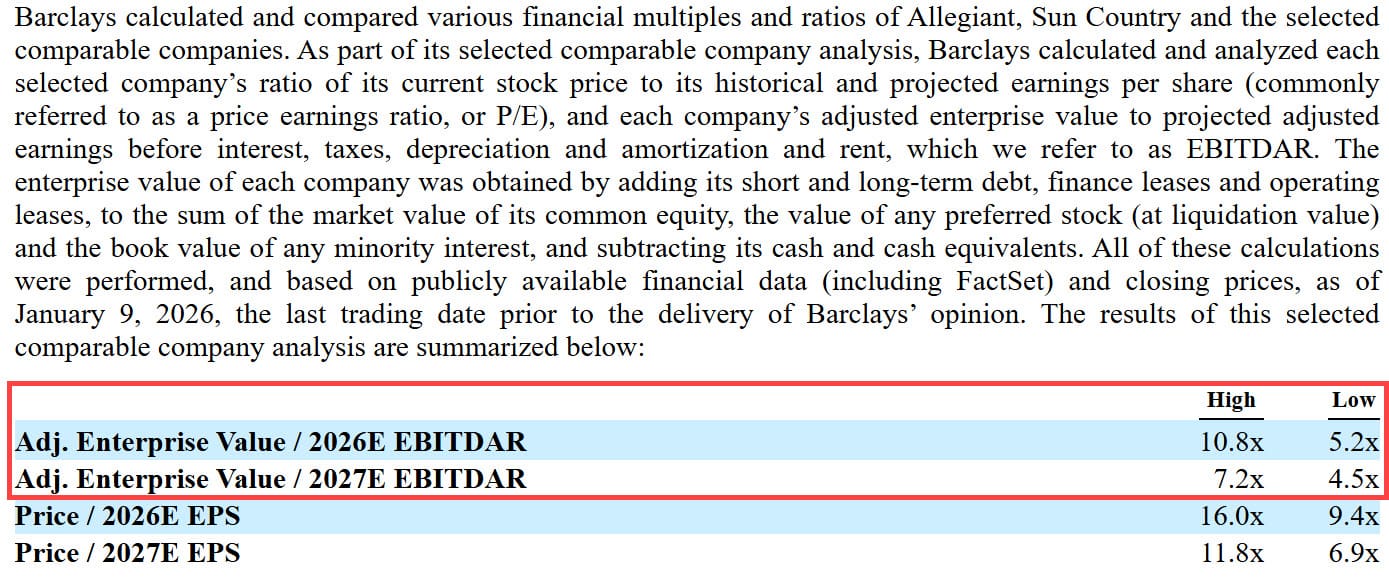
There are other ways to approach this; for example, you could use EBITDA-AL (“EBITDA After Lease Expense”) and subtract the full Lease Expense rather than adding it back, but EBITDAR is the most common approach.
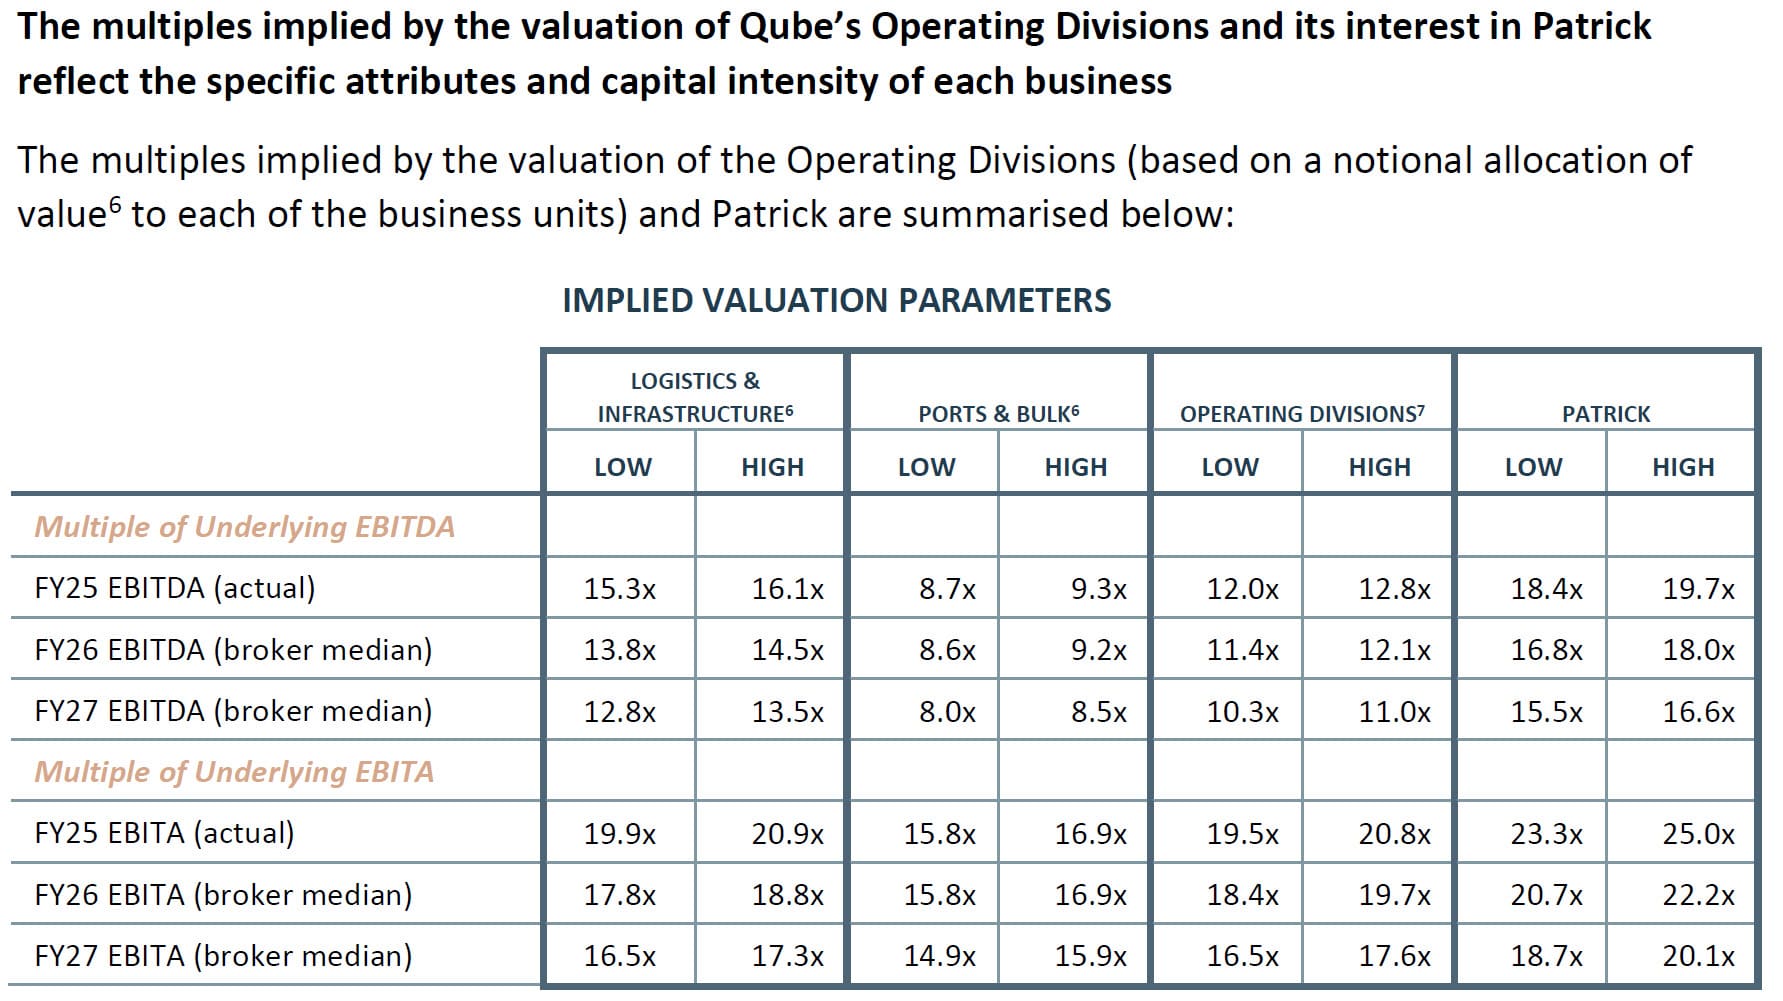
2) Sum-of-the-Parts (SOTP) Valuation – Since many companies in this sector operate across different segments, the SOTP valuation is common.
Here’s an example taken from Grant Samuel’s valuation of Qube, in which the firm applies different EBITDA multiples to different segments of the business:
Example Valuations, Pitch Books, Fairness Opinions, and Investor Presentations
Since there have been so many high-profile deals in the transportation sector, it’s easy to find investor presentations.
Fairness Opinions are more elusive since many assets are private or owned by non-U.S. entities, which means FOs are not necessarily issued in deals:
Air Freight & Logistics
Advent and FedEx / InPost – Acquisition with Multiple Buyers (MS, Lazard, Centerview, Santander, and JPM)
Stonepeak / Air Transport Services Group – Leveraged Buyout (GS and Evercore)
DSV A/S / Schenker AG – Acquisition (MS and HSBC)
Forward Air Corporation / Omni Logistics – Acquisition (Citi, MS, GS, and JPM)
Passenger Airlines
Volaris / Viva – Merger (MS, UBS, and Alfaro, Dávila and Scherer, S.C.)
Alaska Air / Hawaiian – Merger (BofA, PJT, and Barclays)
Allegiant / Sun Country – Merger (Barclays and GS)
- Investor Presentation
- Fairness Opinions – Barclays | GS
Marine Transportation
Sakal / ZIM Integrated Shipping and Hapag-Lloyd / ZIM Integrated Shipping – Competing Acquisition Offers (BofA, Barclays, and Evercore)
- Investor Presentation
- Fairness Opinion (search for “Opinion of ZIM’s Financial Advisors—Evercore Group L.L.C.” on page 62)
UniSuper / Qube Holdings – Acquisition (Macquarie, UBS, and Grant Samuel)
Diana Shipping / Genco Shipping – Hostile Takeover Attempt and Proxy Fight (DNB Carnegie, Jefferies, and MS)
Ground Transportation
Union Pacific / Norfolk Southern – Merger (BofA, MS, and Wells Fargo)
Canadian Pacific Railway / Kansas City Southern – Acquisition (BMO, Evercore, GS, BofA, and MS)
- Investor Presentation
- Fairness Opinions – MS | BofA
- Offering Circular (Canadian requirement)
EQT / First Student Inc. and First Transit – Divestiture and Leveraged Buyout (Barclays, BMO, MS, GS, JPM, and Rothschild)
Aurizon / One Rail Australia – Acquisition (GS, CS, and Macquarie)
The Top Transportation Investment Banking Groups and Firms
Since transportation is usually grouped within industrials, the “top groups” are the same.
That means the usual suspects: GS, JPM, MS, BofA, and Citi, for example.
Technically, MS is often below the other four in the league tables in terms of fee volume, but I’m still listing it here because it’s the only one with a well-known, dedicated transportation/logistics team.
The other bulge brackets are also fine, and Wells Fargo is active since it’s strong in debt.
Among the elite boutiques, Evercore is probably the strongest in this vertical, but you can’t go wrong with any of them.
If you consider the middle-market banks, Jefferies is unsurprisingly #1 overall; firms like Baird, Raymond James, Houlihan Lokey, William Blair, Stephens, Brown Gibbons Lang & Co., Piper Sandler, and Oppenheimer also work on transportation deals.
There are not many true transportation-dedicated boutique banks.
The two best-known are probably Seabury Aviation Partners (air focus) and EVE Partners.
Other names include Bluejay Advisors, AMA Capital Partners (merchant bank; also does energy), Eurofin Group (maritime), and Logisyn.
Finally, there are “diversified boutiques with a transportation focus/strength,” such as PMCF, Rubicon, Bridgepoint, Capstone, and Intrepid Partners (now being acquired by HL).
Exit Opportunities
Exit opportunities coming from transportation IB are broad because it’s a generalist sector without much specialized accounting, valuation, or terminology.
So, you could go to one of the hundreds of PE firms that focus on industrials, join a hedge fund, or go the corporate development/finance route.
Traditionally, venture capital has been a weak spot for exits, but this may be less true these days.
After all, “ground transportation” companies like Uber and DiDi were once VC-backed startups, and as self-driving tech and drones keep advancing, VCs will inevitably fund more transportation-related companies.
How to Learn More About Transportation
I’ll separate this by vertical:
- Air Freight & Logistics: Air Cargo News, Freight Waves, and The Loadstar; for industry reports, see Capstone Insights and select Transportation & Logistics
- Passenger Airlines: Airport World, Airline Weekly, and Simple Flying
- Marine Transportation: Marine Money, TradeWinds News, and The Maritime Executive
- Ground Transportation: The Journal of Commerce, Railway Age, Toll Roads News, and Trucking Dive
We do not have a dedicated transportation financial modeling course, but the other courses and guides cover many industrials-related companies. For example:
- IB Interview Guide – Includes case studies on LATAM Airlines, Diana Shipping, and Central Japan Railway.
- Core Financial Modeling – Includes case studies on Stadler Rail and Steel Dynamics.
- Private Equity Modeling – Includes case studies on Viridor and Superior Industries.
- Oil & Gas Modeling – Includes a case study based on Frontline, an oil tanker company.
Only the first three in the Interview Guide are 100% transportation companies, but the others operate in adjacent markets.
Should You Catch the Next Train into Transportation Investment Banking?
Just as there are many reasons to go into industrials investment banking, there are also many reasons to specialize in transportation.
Deal activity is broad and diverse, you won’t get pigeonholed, and you’ll gain a lot of exposure to PE firms and leveraged buyouts.
It is highly sensitive to economic activity, but that’s true of many sectors.
And it isn’t necessarily the best choice for VC roles, though that is changing due to tech advancements.
The only other downside is that while there are quite a few mega-deals, they seem to be more sporadic than in the other verticals.
For example, there were quite a few railroad and airport mega-deals coming out of COVID in 2021 – 2022, but the pace has slowed since then, with activity shifting to different areas.
But this is a very minor negative against a long list of positives.
In short, if you’re at all interested in transportation, don’t hesitate to ride the waves and sail into the group.

About the Author
Brian DeChesare is the Founder of Mergers & Inquisitions and Breaking Into Wall Street. In his spare time, he enjoys lifting weights, running, traveling, obsessively watching TV shows, and defeating Sauron.
Free Exclusive Report: 57-page guide with the action plan you need to break into investment banking - how to tell your story, network, craft a winning resume, and dominate your interviews